Hello Traders,
I wish you merry christmas and happy holiday.
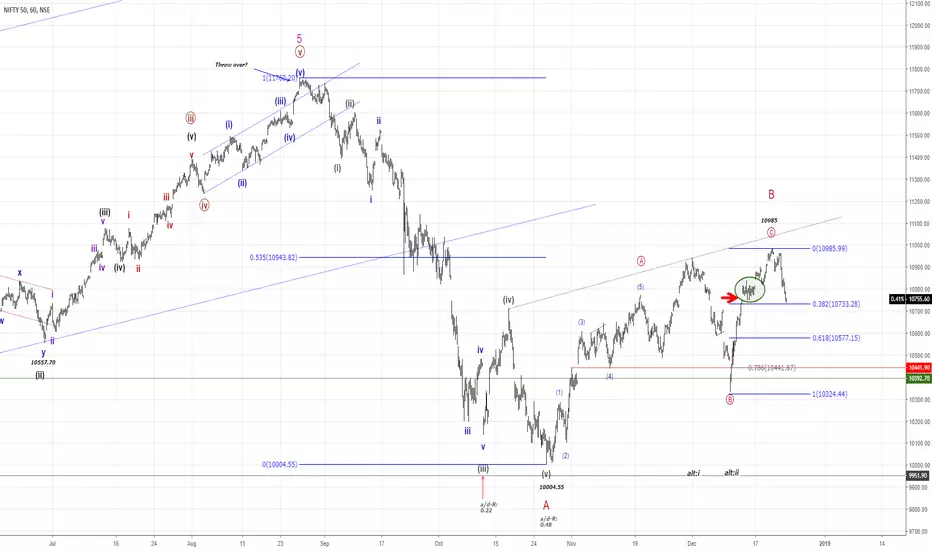
As of my last analyse [NIFTY50] has gaped higher, after taking a „deep breath“ to a new countertrend high. N50 also created a „Island reversal gap“ which often indicate a change of trend.
So by observing the hourly and 15 min chart, since the high at 10985 a sharp cecline to the downside is in progress. The first countertrend from 10985 to 10880 was just retraced by 0.8 tics of the 0.786 retracement. So the odds are to favor, that as long the high at 10985 is in place, the next move is focused to the downside and will lead to an impulsiv structure.
Another pretty good view is to check the SGX NIFTY INDEX Future that too shows the strucure with overlapping waves amd a retracement just shy below the 0.618 Fibonacci.
On the longterm chart you will observe that it is poosible to count a complete „five-up“ which will lead definetly to a correction that has started at 11751.80. The drop down to 1003 is either wave A of this correction or it is done. To my view it is not done, because it is not clear to watch that this drop is a „three-down“! So we might had a Wave „A“ down, a „B“ up and next is „C“ down to fresh new lows. A solid break of the red trendline, that connect the lows from 2008-10-13 @ 2252.75 and 2016-02-29 @ 6825 will a first hint that the wave C down is underway. It is to early to call a price target for such a drop but a possible range could be at 8710. More bearish potencial exist!

On the short term view, price have come back to a 0.382 Fibonacci from 10333-10985. This level is often an important one and will show some reaction by traders and investors. It is quite possible that price will bounce for some hours to correct this drop.
As long as the high at 10985 is not exceed the focus is to the downside. A sizeable targetzone is around the 10582, a 0.618 Fibonacci.
A solid close below the 10473 will increase the odds for a ongoing decline in N50 while a solid cross above the level of 10880 will eliminate the bearish idea of an impulsiv structure, `cause we will get a „wave cut“ and indicate an a-b-c move, so the next push will be to the upside.
The graph below the analyse show you the TRIN (Arms Index) which is often use as an indicator for oversold/overbought levels. There is nothing to observe that show some extraordinary conditions.
traderscockpit.com/?pageView=historical-nse-advance-decline-ratio-chart-and-nse-adline-chart
Just a quick look to the „option chain“ shows some interesting position in case of OI for N50! There is a huge OI around the 10K area which possible will lead N50 to a sharp decline within the next days or weeks, because investors will do „everyhing“, sooner or later, to get there positions „into money“! The Put/Call-Ratio (Dec 27, 2018) for NIFTY IT shows a Ratio of 2 that suggest a bearish sentiment too.
I will update the chart if the odds have changed or a clear wave strucure is to observe.
Have a great day...
ruebennase
I wish you merry christmas and happy holiday.
As of my last analyse [NIFTY50] has gaped higher, after taking a „deep breath“ to a new countertrend high. N50 also created a „Island reversal gap“ which often indicate a change of trend.
So by observing the hourly and 15 min chart, since the high at 10985 a sharp cecline to the downside is in progress. The first countertrend from 10985 to 10880 was just retraced by 0.8 tics of the 0.786 retracement. So the odds are to favor, that as long the high at 10985 is in place, the next move is focused to the downside and will lead to an impulsiv structure.
Another pretty good view is to check the SGX NIFTY INDEX Future that too shows the strucure with overlapping waves amd a retracement just shy below the 0.618 Fibonacci.
On the longterm chart you will observe that it is poosible to count a complete „five-up“ which will lead definetly to a correction that has started at 11751.80. The drop down to 1003 is either wave A of this correction or it is done. To my view it is not done, because it is not clear to watch that this drop is a „three-down“! So we might had a Wave „A“ down, a „B“ up and next is „C“ down to fresh new lows. A solid break of the red trendline, that connect the lows from 2008-10-13 @ 2252.75 and 2016-02-29 @ 6825 will a first hint that the wave C down is underway. It is to early to call a price target for such a drop but a possible range could be at 8710. More bearish potencial exist!
On the short term view, price have come back to a 0.382 Fibonacci from 10333-10985. This level is often an important one and will show some reaction by traders and investors. It is quite possible that price will bounce for some hours to correct this drop.
As long as the high at 10985 is not exceed the focus is to the downside. A sizeable targetzone is around the 10582, a 0.618 Fibonacci.
A solid close below the 10473 will increase the odds for a ongoing decline in N50 while a solid cross above the level of 10880 will eliminate the bearish idea of an impulsiv structure, `cause we will get a „wave cut“ and indicate an a-b-c move, so the next push will be to the upside.
The graph below the analyse show you the TRIN (Arms Index) which is often use as an indicator for oversold/overbought levels. There is nothing to observe that show some extraordinary conditions.
traderscockpit.com/?pageView=historical-nse-advance-decline-ratio-chart-and-nse-adline-chart
Just a quick look to the „option chain“ shows some interesting position in case of OI for N50! There is a huge OI around the 10K area which possible will lead N50 to a sharp decline within the next days or weeks, because investors will do „everyhing“, sooner or later, to get there positions „into money“! The Put/Call-Ratio (Dec 27, 2018) for NIFTY IT shows a Ratio of 2 that suggest a bearish sentiment too.
I will update the chart if the odds have changed or a clear wave strucure is to observe.
Have a great day...
ruebennase
إخلاء المسؤولية
The information and publications are not meant to be, and do not constitute, financial, investment, trading, or other types of advice or recommendations supplied or endorsed by TradingView. Read more in the Terms of Use.
إخلاء المسؤولية
The information and publications are not meant to be, and do not constitute, financial, investment, trading, or other types of advice or recommendations supplied or endorsed by TradingView. Read more in the Terms of Use.