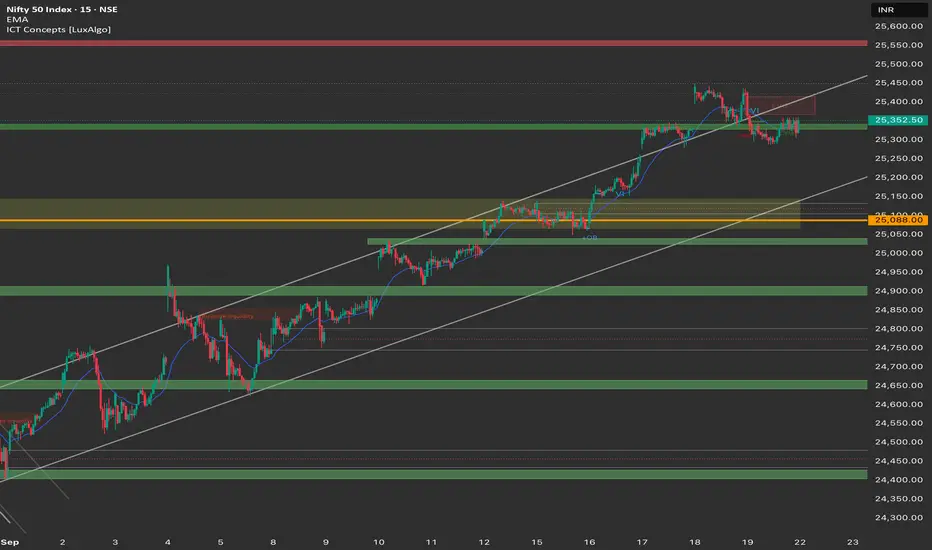
Current NIFTY 50 (Close on September 19): 25,353.00
Overarching Theme: The Nifty is currently undergoing a short-term correction after a powerful rally. While the long-term trend remains bullish, the price action on Friday showed a clear rejection from the highs, leading to a break in the intraday structure. For Monday, the focus will be on whether the market can defend key support levels or if the selling pressure will continue.
Detailed Market Structure Breakdown
4-Hour Chart (Macro Trend)
Structure: The macro structure is still firmly bullish. The price remains within the ascending channel and is holding above the significant support zones. The recent sell-off on Friday, however, created a bearish-looking candle on this timeframe, suggesting some profit-booking at higher levels.
Key Levels:
Major Supply Zone (Resistance): 25,550 - 25,600. This level is a major overhead resistance where the price was rejected on Friday. It will be the key hurdle for bulls to overcome.
Major Demand Zone (Support): The most critical support is the prior breakout level at 25,050 - 25,100. This area is a high-probability reversal zone and would be a strong buy-on-dips opportunity if the market corrects that far.
Outlook: The long-term trend is not in doubt, but the current price action warns of a potential deeper pullback.
1-Hour Chart (Intermediate View)
Structure: This timeframe shows a clear Market Structure Shift (MSS) to the downside. The price broke below its immediate support, confirming the short-term change in momentum. The market has now formed a lower high and a lower low, indicating a corrective phase is in play.
Key Levels:
Immediate Resistance: The 25,400 level, which served as support before the breakdown, is now a key resistance level for the bulls to recapture.
Immediate Support: The 25,250 level. This area is a key FVG (Fair Value Gap) and a psychological level that must hold to prevent a sharper fall.
Outlook: The 1H chart suggests that the market is in a short-term corrective phase. The bulls must defend the 25,250 level.
15-Minute Chart (Intraday View)
Structure: The 15M chart shows the market is in a tight consolidation range after Friday's decline. The price is trading sideways, with a defined range.
Key Levels:
Intraday Supply Zone: The top of the range at 25,400.
Intraday Demand Zone: The bottom of the range at 25,300.
Outlook: The market is at an inflection point. The direction of the break from this range will determine the intraday trend for Monday's session.
📈 Today's Trade Plan (Monday, 22nd September)
Market Outlook: The market is at a crossroads. While the macro trend is bullish, the short-term momentum is bearish. The best strategy is to wait for a clear breakout or breakdown from the current consolidation range.
Bullish Scenario (Primary Plan)
Justification: A decisive breakout from the intraday range would signal the end of the short-term correction and a continuation of the primary uptrend.
Entry: Long entry on a sustained break and 15-minute candle close above 25,400.
Stop Loss (SL): Below 25,350.
Targets:
T1: 25,450 (Recent resistance).
T2: 25,550 (4H chart major resistance).
Bearish Scenario (Counter-Trend Plan)
Justification: A breakdown from the intraday range could lead to a deeper correction to re-test the intermediate demand zones.
Trigger: A confirmed breakdown and 15-minute candle close below 25,300.
Entry: Short entry on a breakdown retest of the 25,300 level.
Stop Loss (SL): Above 25,350.
Targets:
T1: 25,250 (1H chart FVG demand zone).
T2: 25,100 (Major 4H chart support).
Key Levels for Observation:
Immediate Decision Point: 25,300 - 25,400.
Bullish Confirmation: A break above 25,400.
Bearish Confirmation: A break below 25,300.
Line in the Sand: The 25,250 level is a crucial support. A break below this would signal a significant shift to a more bearish bias.
إخلاء المسؤولية
لا يُقصد بالمعلومات والمنشورات أن تكون، أو تشكل، أي نصيحة مالية أو استثمارية أو تجارية أو أنواع أخرى من النصائح أو التوصيات المقدمة أو المعتمدة من TradingView. اقرأ المزيد في شروط الاستخدام.
إخلاء المسؤولية
لا يُقصد بالمعلومات والمنشورات أن تكون، أو تشكل، أي نصيحة مالية أو استثمارية أو تجارية أو أنواع أخرى من النصائح أو التوصيات المقدمة أو المعتمدة من TradingView. اقرأ المزيد في شروط الاستخدام.