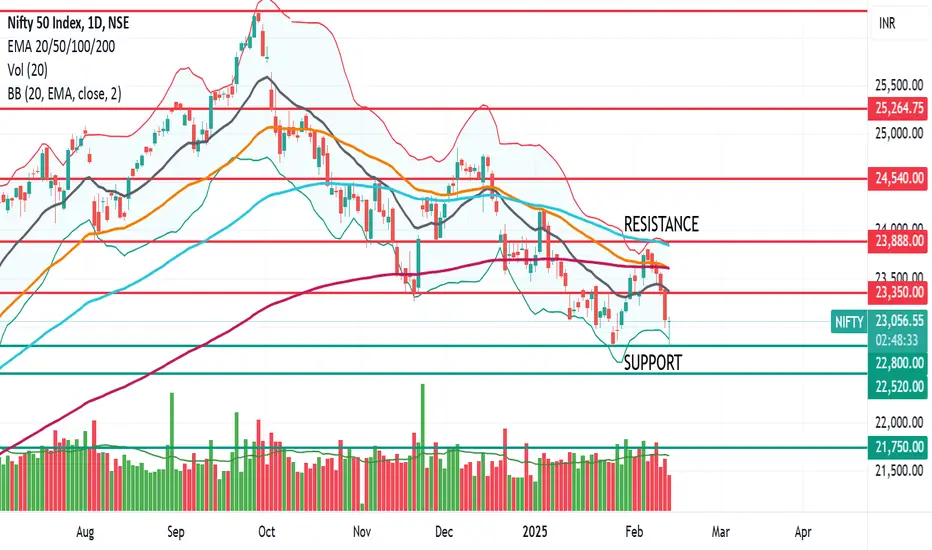
Nifty 50 has recovered from today's low of 22,788 levels to 23, 097.
Thus, 22,800 can be considered as the strong support level.
Any fall below 22,800 could be devastating for the sentiments of retail and short to medium-term investors.
Long-term investors need not worry, as the monthly chart shows bullish mode only with 20 EMA comfortably trading above 50 EMA and 200 EMA
However, the weekly chart shows that the 20 EMA line is trending downwards and just above the 50 EMA.
Thus, the overall sentiment seems bearish, and a strong closing above 23,350 is needed to enhance investor confidence.
Resistance: 23350, 23888, 24540
Support: 22800, 22520, 21750
إخلاء المسؤولية
لا يُقصد بالمعلومات والمنشورات أن تكون، أو تشكل، أي نصيحة مالية أو استثمارية أو تجارية أو أنواع أخرى من النصائح أو التوصيات المقدمة أو المعتمدة من TradingView. اقرأ المزيد في شروط الاستخدام.
إخلاء المسؤولية
لا يُقصد بالمعلومات والمنشورات أن تكون، أو تشكل، أي نصيحة مالية أو استثمارية أو تجارية أو أنواع أخرى من النصائح أو التوصيات المقدمة أو المعتمدة من TradingView. اقرأ المزيد في شروط الاستخدام.