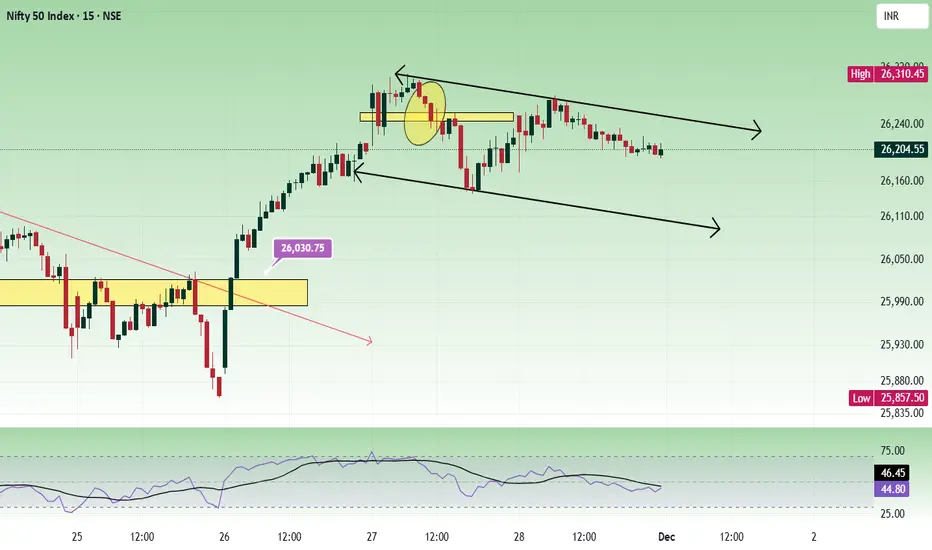
The price was rejected from the resistance at the 26300 - 26320 zone. Sustaining above this is important to move up further. The daily chart shows the price has formed an inside bar. This type of range, when broken with strength, can give good movement.

26000 is the nearby psychological support zone.
If the price opens gap down and takes support from the lower trend line of the channel, buy above 26150 with the stop loss of 26100 for the targets 26190, 26240, 26280, 26320, 26360 and 26420.
Sell below 25980 with the stop loss of 26030 for the targets 25940, 25900, 25860, 25820, 25760 and 25720.
Always do your analysis before taking any trade.
ملاحظة
Trying to test the lower trend line of the channel. Role I play here : Moderator. Follow me in telegram to trade better. t.me/Analysis4Newbie Contact information : tradingplan4u@gmail.com
إخلاء المسؤولية
لا يُقصد بالمعلومات والمنشورات أن تكون، أو تشكل، أي نصيحة مالية أو استثمارية أو تجارية أو أنواع أخرى من النصائح أو التوصيات المقدمة أو المعتمدة من TradingView. اقرأ المزيد في شروط الاستخدام.
Role I play here : Moderator. Follow me in telegram to trade better. t.me/Analysis4Newbie Contact information : tradingplan4u@gmail.com
إخلاء المسؤولية
لا يُقصد بالمعلومات والمنشورات أن تكون، أو تشكل، أي نصيحة مالية أو استثمارية أو تجارية أو أنواع أخرى من النصائح أو التوصيات المقدمة أو المعتمدة من TradingView. اقرأ المزيد في شروط الاستخدام.