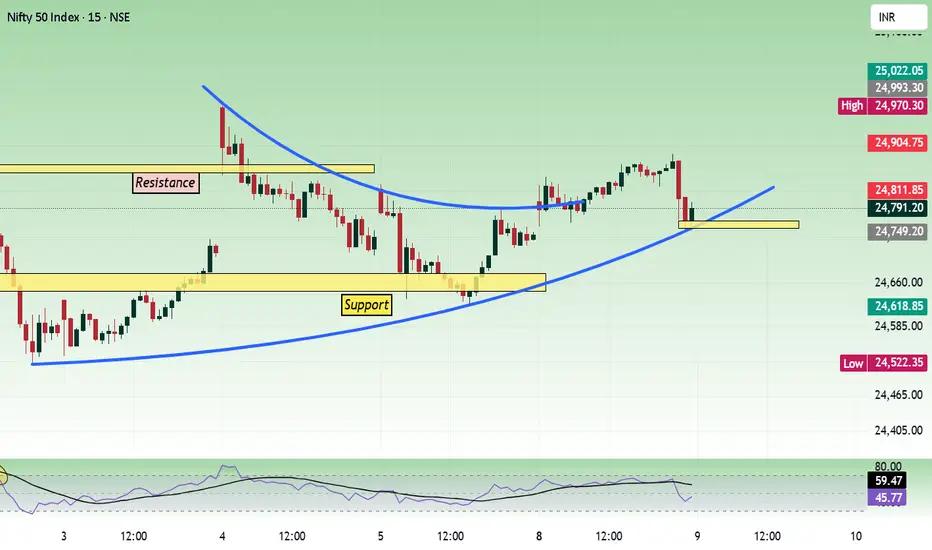
Today, the price did not gain strength and moved in the range of 24700 to 24900. And 25000 is a psychological level. This type of nearby support/resistance can give choppy movement unless the price shows strength from the opening.
Support levels are 24500, 24600. Resistance levels are 24900, 25000.
We can buy if the price opens at support with bullish strength.
If the opening is flat, buy above 24820 with the stop loss of 24770 for the targets 24860, 24920, 24980, 25020, and 25080.
Sell below 24680 with the stop loss of 24730 for the targets 24640, 24600, 24540, 24500, 24460 and 24420.
As per the daily chart, the price is moving in a range, and it also has nearby trendline resistance.
Strong movement can happen if the trend line is taken with strength.

As per the hour chart, if the price does not gain strength when breaking the range it has formed today, then the expiry will be in range.

Expected expiry day range is 24400 to 24900.
Support levels are 24500, 24600. Resistance levels are 24900, 25000.
We can buy if the price opens at support with bullish strength.
If the opening is flat, buy above 24820 with the stop loss of 24770 for the targets 24860, 24920, 24980, 25020, and 25080.
Sell below 24680 with the stop loss of 24730 for the targets 24640, 24600, 24540, 24500, 24460 and 24420.
As per the daily chart, the price is moving in a range, and it also has nearby trendline resistance.
Strong movement can happen if the trend line is taken with strength.
As per the hour chart, if the price does not gain strength when breaking the range it has formed today, then the expiry will be in range.
Expected expiry day range is 24400 to 24900.
تم فتح الصفقة
Long. T1 done. testing resistance. ملاحظة
Range. Role I play here : Moderator. Follow me in telegram to trade better. t.me/Analysis4Newbie Contact information : tradingplan4u@gmail.com
إخلاء المسؤولية
لا يُقصد بالمعلومات والمنشورات أن تكون، أو تشكل، أي نصيحة مالية أو استثمارية أو تجارية أو أنواع أخرى من النصائح أو التوصيات المقدمة أو المعتمدة من TradingView. اقرأ المزيد في شروط الاستخدام.
Role I play here : Moderator. Follow me in telegram to trade better. t.me/Analysis4Newbie Contact information : tradingplan4u@gmail.com
إخلاء المسؤولية
لا يُقصد بالمعلومات والمنشورات أن تكون، أو تشكل، أي نصيحة مالية أو استثمارية أو تجارية أو أنواع أخرى من النصائح أو التوصيات المقدمة أو المعتمدة من TradingView. اقرأ المزيد في شروط الاستخدام.