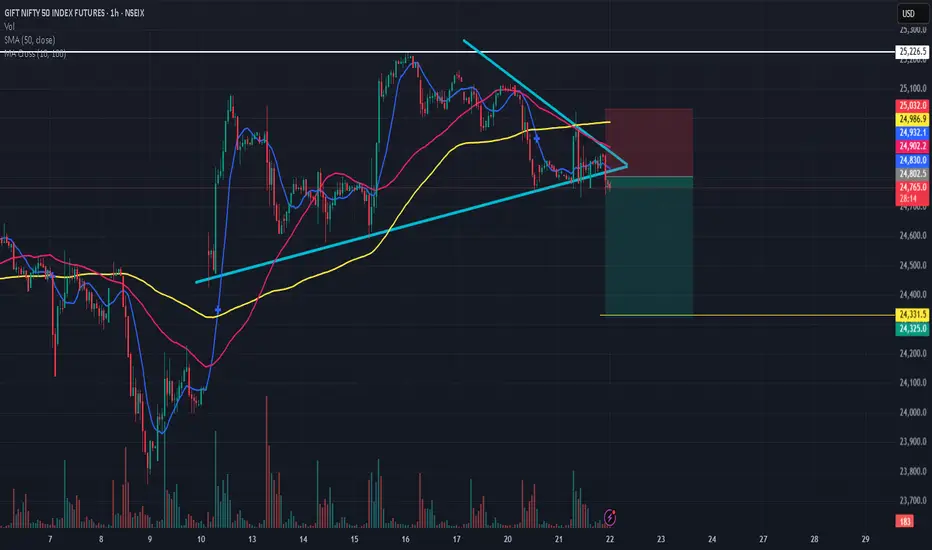
A triangle chart pattern is a tool used in technical analysis. Named for its resemblance to a series of triangles, the triangle chart pattern is created by drawing trendlines along a converging price range. The result signals a pause in the prevailing trend.
Technical analysts read the triangle as an indicator of a continuation of an existing trend or reversal.
Despite being a continuation, traders should look for breakouts before they make a move to buy or sell.
Technical analysts read the triangle as an indicator of a continuation of an existing trend or reversal.
Despite being a continuation, traders should look for breakouts before they make a move to buy or sell.
إخلاء المسؤولية
لا يُقصد بالمعلومات والمنشورات أن تكون، أو تشكل، أي نصيحة مالية أو استثمارية أو تجارية أو أنواع أخرى من النصائح أو التوصيات المقدمة أو المعتمدة من TradingView. اقرأ المزيد في شروط الاستخدام.
إخلاء المسؤولية
لا يُقصد بالمعلومات والمنشورات أن تكون، أو تشكل، أي نصيحة مالية أو استثمارية أو تجارية أو أنواع أخرى من النصائح أو التوصيات المقدمة أو المعتمدة من TradingView. اقرأ المزيد في شروط الاستخدام.