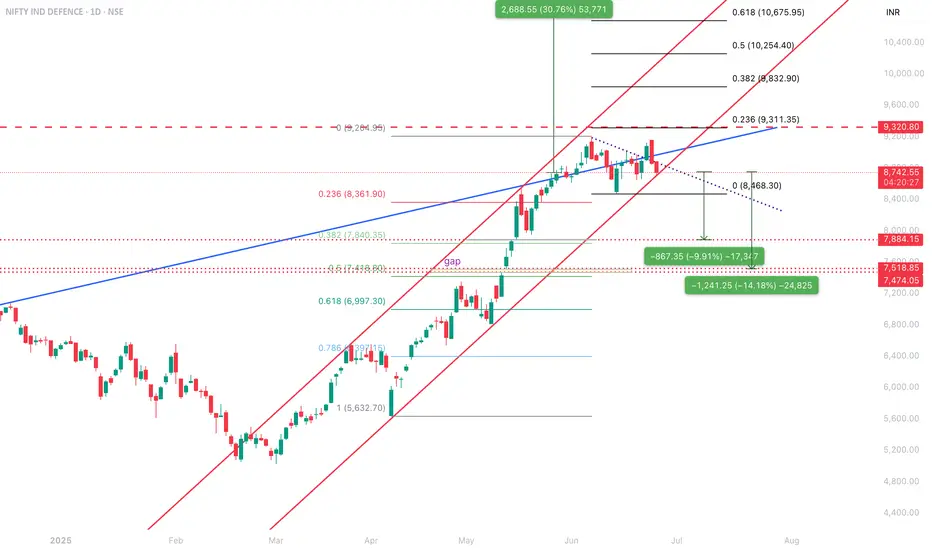
This is a technical analysis chart of the NIFTY IND Defence Index (1D timeframe),
📊 Current Market Status:
• Last Close: ₹8,752.95
• Day’s Change: -₹105.60 (▼1.19%)
• Day’s Range: ₹8,714.55 – ₹8,884.40
🟢 Uptrend Summary (Recent Past):
• Low: ₹5,632.70 (March 2025)
• High: ₹9,204.95 (recent peak)
• Gain: +₹2,688.55 (≈+30.76%)
🧭 Fibonacci Retracement Levels (from swing low to swing high):
• 0.236: ₹8,361.90
• 0.382: ₹7,840.35
• 0.5: ₹7,418.80
• 0.618: ₹6,997.30
• 0.786: ₹6,391.15
🔴 Bearish Signals:
1. Price rejection from top of upward channel
• Price has moved out of the rising red parallel channel.
• Currently testing support, and breakdown seems underway.
2. Break below dotted descending trendline
• Indicates short-term weakness.
3. Gap zone between ~₹7,840–₹7,418 could act as a demand/support zone, but also a magnet if breakdown accelerates.
4. Targeted Downside Projections:
• 1st Target: ₹7,884 (▼9.91% from peak)
• 2nd Target: ₹7,474 (▼14.18% from peak) — aligned near the 0.5 retracement level
🔵 Key Support Zones:
• ₹7,884.15 — Previous strong support zone
• ₹7,518.85–₹7,474.05 — Confluence of gap support and 50% Fibonacci
🔺 Resistance Levels (Upside Challenges):
• ₹9,204.95 — Recent peak (0% retracement)
• ₹9,311.35 — Upper projection/resistance
• ₹9,412.65 — Red dashed resistance line
• ₹9,832.90 — 0.382 projection from upward move
📉 Conclusion & Strategy Outlook:
🔻 Bearish Bias (Short-Term)
• Breakdown of trendline and channel signals a likely correction phase.
• Look for support at ₹7,884, and if breached, expect deeper correction to ₹7,474–7,518.
🔼 Reversal Confirmation (Bullish if):
• Price reclaims and sustains above ₹9,000, breaking past previous swing high.
✅ Action Points:
• Long Holders: Watch ₹8,360 (0.236 fib) — if broken, tighten stop-loss.
• Short Opportunities: Breakdown below ₹8,468 could trigger downside to ₹7,884 and ₹7,474.
• Fresh Entry (Positional Longs): Consider near ₹7,474–7,518 if price shows bullish reversal signals there.
DO YOUR OWN D/D
إخلاء المسؤولية
لا يُقصد بالمعلومات والمنشورات أن تكون، أو تشكل، أي نصيحة مالية أو استثمارية أو تجارية أو أنواع أخرى من النصائح أو التوصيات المقدمة أو المعتمدة من TradingView. اقرأ المزيد في شروط الاستخدام.
إخلاء المسؤولية
لا يُقصد بالمعلومات والمنشورات أن تكون، أو تشكل، أي نصيحة مالية أو استثمارية أو تجارية أو أنواع أخرى من النصائح أو التوصيات المقدمة أو المعتمدة من TradingView. اقرأ المزيد في شروط الاستخدام.