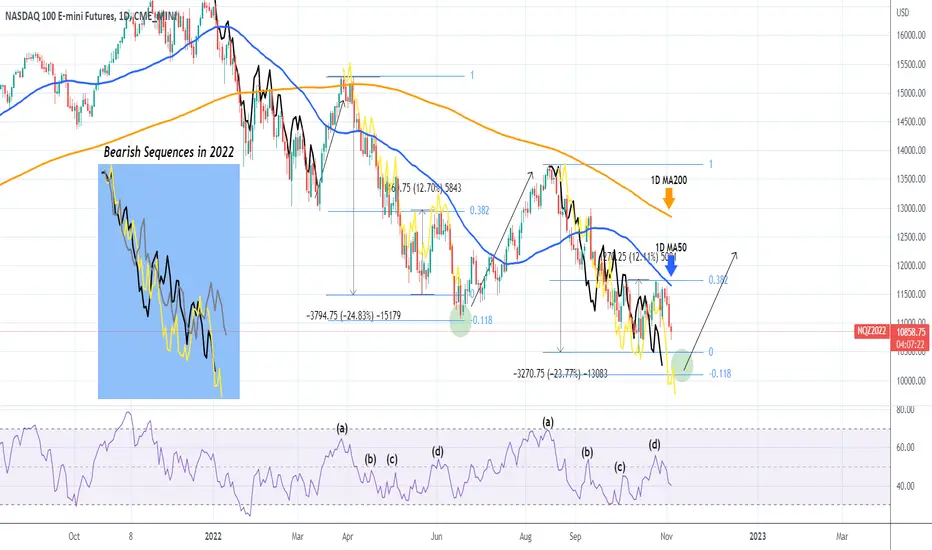
Nasdaq (NDX) is pulling-back following the Fed's +0.75% Rate Hike and a rejection on Tuesday on the 1D MA50 (blue trend-line). With the help of the RSI on the 1D time-frame, we can see that so far the whole bearish sequence since the August 16 High, is very similar to the bearish sequence that followed after the March 30 High.
A striking similarity is that both got rejected on the 0.382 Fibonacci retracement level just under the 1D MA50. On June 03 that was the rejection that delivered the last sell-off before the mid-June - mid-August rally. That sell-off made its Low on the -0.118 Fibonacci extension. On the current Bearish Sequence, this extension is on 10105.
For illustration and better comparison purposes, I have plotted the first two Bearish Sequences od 2022 on top of the current (post August 16 High) and on the blue table all three together. The pattern is obvious.
-------------------------------------------------------------------------------
** Please LIKE 👍, SUBSCRIBE ✅, SHARE 🙌 and COMMENT ✍ if you enjoy this idea! Also share your ideas and charts in the comments section below! This is best way to keep it relevant, support me, keep the content here free and allow the idea to reach as many people as possible. **
-------------------------------------------------------------------------------
You may also TELL ME 🙋♀️🙋♂️ in the comments section which symbol you want me to analyze next and on which time-frame. The one with the most posts will be published tomorrow! 👏🎁
-------------------------------------------------------------------------------
👇 👇 👇 👇 👇 👇
💸💸💸💸💸💸
👇 👇 👇 👇 👇 👇
👑Best Signals (Forex/Crypto+70% accuracy) & Account Management (+20% profit/month on 10k accounts)
💰Free Channel t.me/tradingshotglobal
🤵Contact info@tradingshot.com t.me/tradingshot
🔥New service: next X100 crypto GEMS!
💰Free Channel t.me/tradingshotglobal
🤵Contact info@tradingshot.com t.me/tradingshot
🔥New service: next X100 crypto GEMS!
إخلاء المسؤولية
لا يُقصد بالمعلومات والمنشورات أن تكون، أو تشكل، أي نصيحة مالية أو استثمارية أو تجارية أو أنواع أخرى من النصائح أو التوصيات المقدمة أو المعتمدة من TradingView. اقرأ المزيد في شروط الاستخدام.