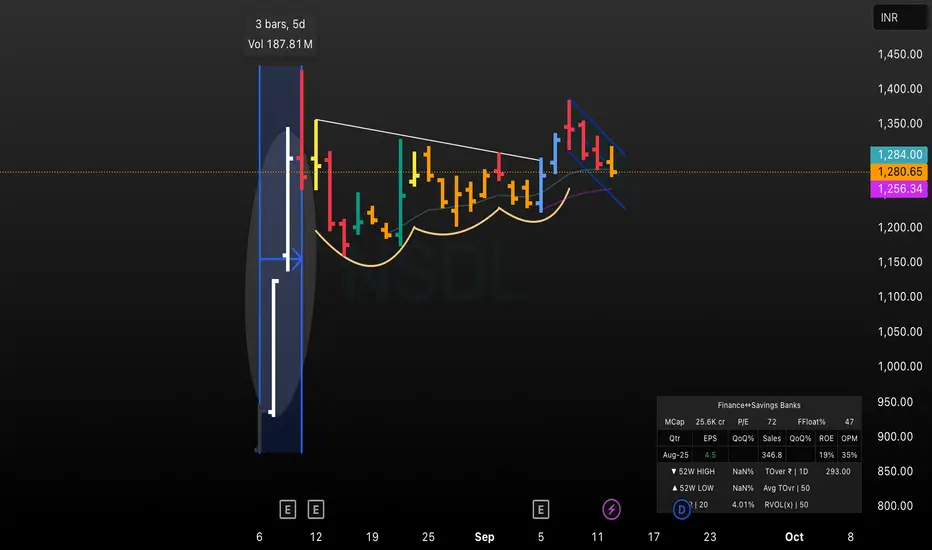
This chart highlights NSDL’s sharp volatility spike (high-volume move) followed by base formation. After explosive price action, the stock began forming higher lows, indicating accumulation. Recent price action shows a bullish setup with contracting ranges, suggesting a possible breakout above resistance. Tracking volume and price structure for next trade move is key.
إخلاء المسؤولية
لا يُقصد بالمعلومات والمنشورات أن تكون، أو تشكل، أي نصيحة مالية أو استثمارية أو تجارية أو أنواع أخرى من النصائح أو التوصيات المقدمة أو المعتمدة من TradingView. اقرأ المزيد في شروط الاستخدام.
إخلاء المسؤولية
لا يُقصد بالمعلومات والمنشورات أن تكون، أو تشكل، أي نصيحة مالية أو استثمارية أو تجارية أو أنواع أخرى من النصائح أو التوصيات المقدمة أو المعتمدة من TradingView. اقرأ المزيد في شروط الاستخدام.