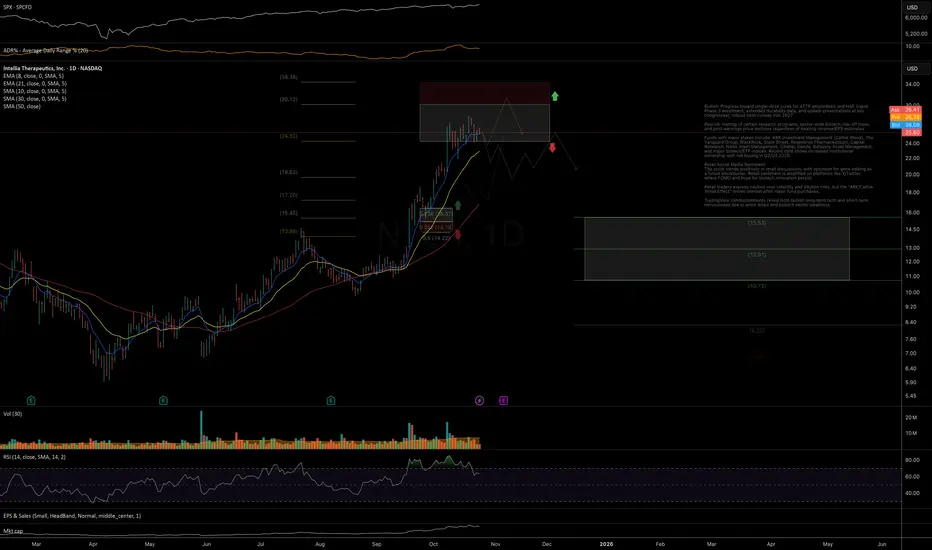
Price has followed through strongly from the mid-term support outlined in the September update, moving directly into the target mid-term resistance zone.
As long as the price remains below 30, I expect a near-term pullback below the 21dEMA to complete the first leg of decline.
If, however, the price breaks out above the October highs, it would open the door for further extensions toward the 31–34 resistance zone in the short term.
Chart:

Previously:
On bullish trend structure and support zone (Sep 26):
Chart:
https://www.tradingview.com/symbols/NASDAQ-NTLA/minds/?mind=B8f6LFmoSxGopGg
On resistance zone and pullback potential (Oct 8 and Oct 13):
Chart:
See weekly review: https://www.tradingview.com/chart/BITF/MXF8r9gK-Weekly-Chart-Review-Oct-6-10-2025/
As long as the price remains below 30, I expect a near-term pullback below the 21dEMA to complete the first leg of decline.
If, however, the price breaks out above the October highs, it would open the door for further extensions toward the 31–34 resistance zone in the short term.
Chart:
Previously:
On bullish trend structure and support zone (Sep 26):
Chart:
https://www.tradingview.com/symbols/NASDAQ-NTLA/minds/?mind=B8f6LFmoSxGopGg
On resistance zone and pullback potential (Oct 8 and Oct 13):
Chart:
See weekly review: https://www.tradingview.com/chart/BITF/MXF8r9gK-Weekly-Chart-Review-Oct-6-10-2025/
أغلقت الصفقة: تم الوصول للهدف
That was fast 📊 Daily FREE Market Insights | Crypto + US Stocks
⚡ Technical analysis, setups & commentary
🌍 t.me/MarketArtistryENG | 🇷🇺 t.me/marketartistry
Join and let's grow together! 🚀
⚡ Technical analysis, setups & commentary
🌍 t.me/MarketArtistryENG | 🇷🇺 t.me/marketartistry
Join and let's grow together! 🚀
إخلاء المسؤولية
لا يُقصد بالمعلومات والمنشورات أن تكون، أو تشكل، أي نصيحة مالية أو استثمارية أو تجارية أو أنواع أخرى من النصائح أو التوصيات المقدمة أو المعتمدة من TradingView. اقرأ المزيد في شروط الاستخدام.
📊 Daily FREE Market Insights | Crypto + US Stocks
⚡ Technical analysis, setups & commentary
🌍 t.me/MarketArtistryENG | 🇷🇺 t.me/marketartistry
Join and let's grow together! 🚀
⚡ Technical analysis, setups & commentary
🌍 t.me/MarketArtistryENG | 🇷🇺 t.me/marketartistry
Join and let's grow together! 🚀
إخلاء المسؤولية
لا يُقصد بالمعلومات والمنشورات أن تكون، أو تشكل، أي نصيحة مالية أو استثمارية أو تجارية أو أنواع أخرى من النصائح أو التوصيات المقدمة أو المعتمدة من TradingView. اقرأ المزيد في شروط الاستخدام.