Here’s my take on Nvidia heading into Wednesday’s session, based on the 1-hour chart and current GEX data.
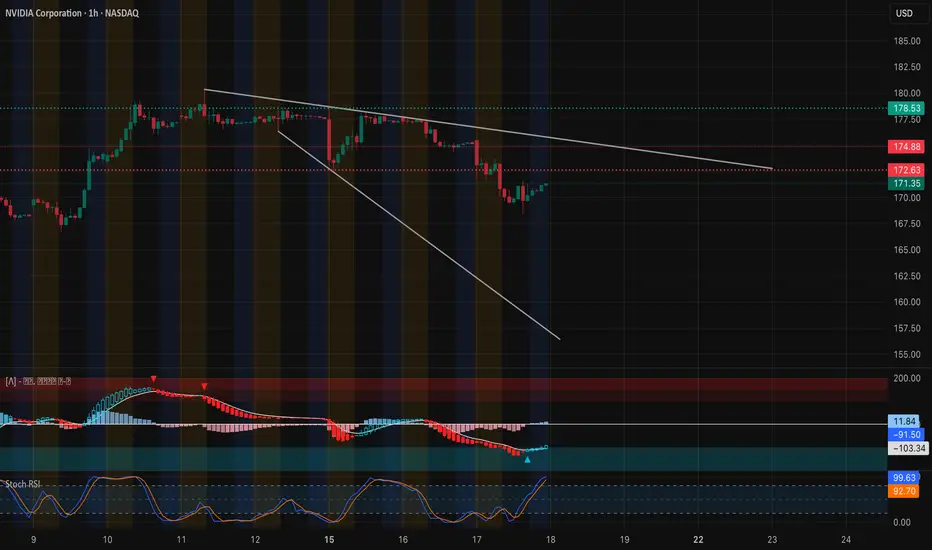
1️⃣ Price Action & Market Structure
* Trend check: NVDA is still in a short-term downtrend after last week’s selloff, but buyers stepped in near $168–170, which lines up with prior volume support.
* Key level: $172.5 is a near-term pivot. Price is testing it now; a sustained push above could start a relief bounce toward $175–177.
* Resistance overhead: The descending trendline around $174.8–175 is the first real test for bulls. Above that, $178.5 and $182.5 are next supply zones.

2️⃣ GEX (Options Flow) Read
* Call/put balance: Calls only about 25% of flow—puts still dominate, showing cautious sentiment.
* Put walls: Big put interest at $170 and $165 creates a “magnet” if $172.5 fails.
* Call side: Not much until $177.5 and $182.5, where gamma clusters could help a squeeze if buyers surprise.
3️⃣ Trading Thoughts
* Conservative long scalp: If NVDA closes an hourly candle above $172.5–174, a pop toward $177–178.5 is on the table. Tight stop under $170.
* Short setup: If price rejects $172.5 and slips back below $170, expect a quick test of $167.5, maybe $165 on momentum.
4️⃣ Option Angle
* Directional play: Debit spreads (e.g., $175/$180 calls) are fine for a bounce if price confirms over $174.
* Income angle: Credit spreads selling $165 puts or $180 calls fit a range-bound view if you expect more chop.
5️⃣ My View
Nvidia is oversold enough to bounce, but the overall tape is still heavy. I’ll wait for an hourly close over $174 to trust the long side. Otherwise, any fade below $170 keeps the short trend alive.
Disclaimer: This analysis is for educational discussion only and does not constitute financial advice. Always do your own research and manage risk before trading.
1️⃣ Price Action & Market Structure
* Trend check: NVDA is still in a short-term downtrend after last week’s selloff, but buyers stepped in near $168–170, which lines up with prior volume support.
* Key level: $172.5 is a near-term pivot. Price is testing it now; a sustained push above could start a relief bounce toward $175–177.
* Resistance overhead: The descending trendline around $174.8–175 is the first real test for bulls. Above that, $178.5 and $182.5 are next supply zones.
2️⃣ GEX (Options Flow) Read
* Call/put balance: Calls only about 25% of flow—puts still dominate, showing cautious sentiment.
* Put walls: Big put interest at $170 and $165 creates a “magnet” if $172.5 fails.
* Call side: Not much until $177.5 and $182.5, where gamma clusters could help a squeeze if buyers surprise.
3️⃣ Trading Thoughts
* Conservative long scalp: If NVDA closes an hourly candle above $172.5–174, a pop toward $177–178.5 is on the table. Tight stop under $170.
* Short setup: If price rejects $172.5 and slips back below $170, expect a quick test of $167.5, maybe $165 on momentum.
4️⃣ Option Angle
* Directional play: Debit spreads (e.g., $175/$180 calls) are fine for a bounce if price confirms over $174.
* Income angle: Credit spreads selling $165 puts or $180 calls fit a range-bound view if you expect more chop.
5️⃣ My View
Nvidia is oversold enough to bounce, but the overall tape is still heavy. I’ll wait for an hourly close over $174 to trust the long side. Otherwise, any fade below $170 keeps the short trend alive.
Disclaimer: This analysis is for educational discussion only and does not constitute financial advice. Always do your own research and manage risk before trading.
إخلاء المسؤولية
لا يُقصد بالمعلومات والمنشورات أن تكون، أو تشكل، أي نصيحة مالية أو استثمارية أو تجارية أو أنواع أخرى من النصائح أو التوصيات المقدمة أو المعتمدة من TradingView. اقرأ المزيد في شروط الاستخدام.
إخلاء المسؤولية
لا يُقصد بالمعلومات والمنشورات أن تكون، أو تشكل، أي نصيحة مالية أو استثمارية أو تجارية أو أنواع أخرى من النصائح أو التوصيات المقدمة أو المعتمدة من TradingView. اقرأ المزيد في شروط الاستخدام.