**Volatility Contraction Pattern (VCP)** – popularized by Mark Minervini as a high-probability breakout setup.
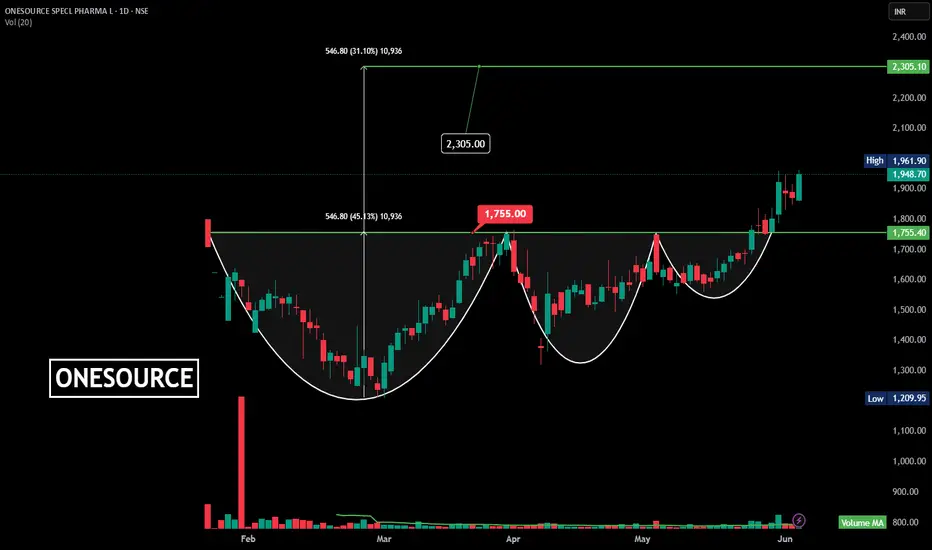
Here’s a breakdown of the VCP structure for the **ONESOURCE SPECPL PHARMA LTD** chart:
---
**🔍 VCP Analysis (Volatility Contraction Pattern)**
✅ **Stock:** ONESOURCE SPECPL PHARMA LTD
✅ **Timeframe:** Daily chart
✅ **Pattern:** VCP with sequential tightening of price ranges.
**Key Characteristics:**
* **Contractions (Tightening):**
* **First contraction:** ₹1,755➡️ ₹1,200 (Large drop – “cup”)
* **Second contraction:** ₹1,755 ➡️ ₹1,319 (smaller “handle”)
* **Third contraction:** ₹1,755 ➡️ ₹1,558 (even tighter)
* **Tightening volatility:** Each pullback becomes smaller and volume decreases—a hallmark of VCP.
**✅ Breakout Trigger:**
* Clear breakout above ₹1,755 resistance zone.
* Strong volume surge—confirms institutional accumulation.
**💡 Key Targets:**
* Measured target: ₹2,305 (based on the height of the last contraction leg and breakout zone).
* As long as the price holds above ₹1,755, the VCP breakout is valid.
---
**Takeaway:**
The ONESOURCE chart beautifully illustrates the VCP—each successive contraction tightens, and the breakout confirms the pattern. Traders can use a stop-loss just below ₹1,755 for a risk-managed trade.
إخلاء المسؤولية
لا يُقصد بالمعلومات والمنشورات أن تكون، أو تشكل، أي نصيحة مالية أو استثمارية أو تجارية أو أنواع أخرى من النصائح أو التوصيات المقدمة أو المعتمدة من TradingView. اقرأ المزيد في شروط الاستخدام.
إخلاء المسؤولية
لا يُقصد بالمعلومات والمنشورات أن تكون، أو تشكل، أي نصيحة مالية أو استثمارية أو تجارية أو أنواع أخرى من النصائح أو التوصيات المقدمة أو المعتمدة من TradingView. اقرأ المزيد في شروط الاستخدام.