Summary of ORCL's technical on its daily chart:
Its Resistances:
Its Supports
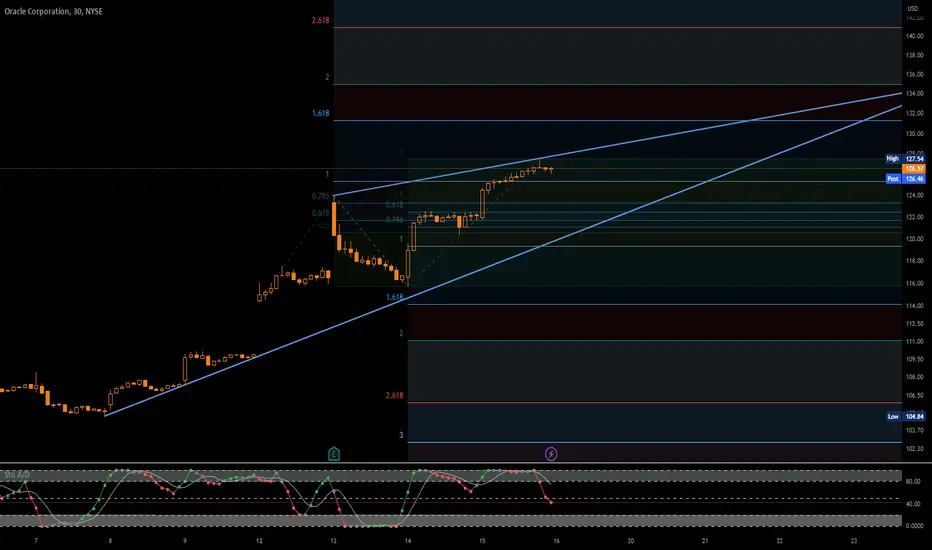
- The RSI is trading above 70. This could mean that either the stock is in a lasting uptrend or just overbought and that therefore a correction could shape (look for bearish divergence in this case). The MACD is above its signal line and positive. The configuration is positive. Moreover, the stock is above its 20 and 50 day moving average (respectively at 106.3455 and 99.8614). Finally, Oracle is trading above its upper Bollinger band (standing at 118.54).
Its Resistances:
- 141.4 **
- 137.6 *
- 133.8 **
- 130
Its Supports
- 113.4
- 111 **
- 105.1 *
- 101.5 **
منشورات ذات صلة
إخلاء المسؤولية
لا يُقصد بالمعلومات والمنشورات أن تكون، أو تشكل، أي نصيحة مالية أو استثمارية أو تجارية أو أنواع أخرى من النصائح أو التوصيات المقدمة أو المعتمدة من TradingView. اقرأ المزيد في شروط الاستخدام.
منشورات ذات صلة
إخلاء المسؤولية
لا يُقصد بالمعلومات والمنشورات أن تكون، أو تشكل، أي نصيحة مالية أو استثمارية أو تجارية أو أنواع أخرى من النصائح أو التوصيات المقدمة أو المعتمدة من TradingView. اقرأ المزيد في شروط الاستخدام.