Current Situation
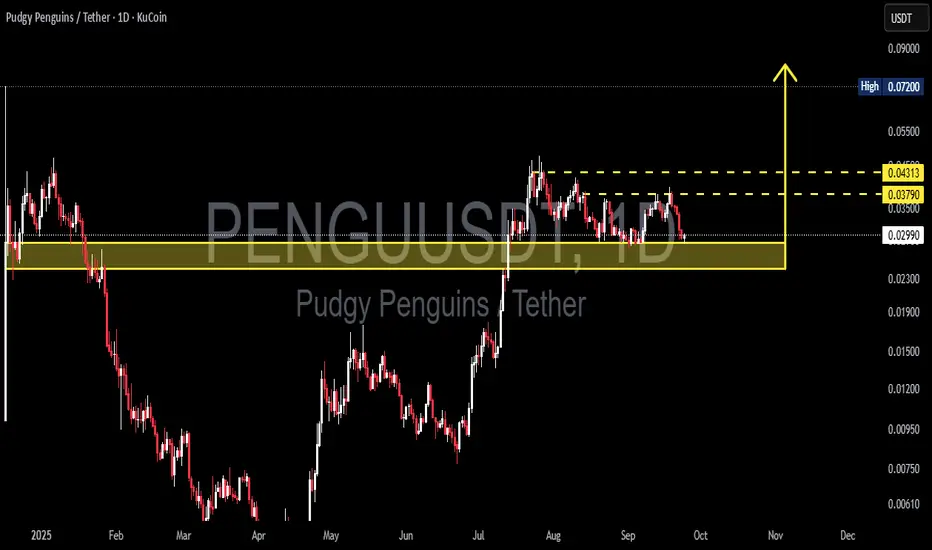
On the daily chart, PENGU/USDT is trading around ~0.0298 USDT, sitting directly above the critical support zone at 0.023 – 0.030 (highlighted in yellow). This zone is significant because:
It previously acted as strong resistance earlier in 2025.
Once broken in July, it flipped into key support (demand zone).
Now it’s being retested, making this area a decisive turning point.
---
Price Structure & Patterns
1. Range Accumulation: After a strong rally in July–August, price is consolidating, creating a potential base.
2. Resistance Cluster: Two overhead resistances are clear:
0.03790 → first minor resistance.
0.04313 → major resistance level.
3. Breakout Potential: A daily close above 0.04313 could open the path toward the structural high at 0.072.
4. Distribution vs. Accumulation: Current range could play out either way — buyers holding the zone (accumulation) or sellers unloading before a deeper breakdown (distribution).
---
Bullish Scenario (Rebound Potential)
Trigger: Daily bullish close above 0.029–0.030 with rising volume.
Short-term targets:
0.03790 → minor resistance.
0.04313 → major upside target in this range.
Mid-term target: A confirmed breakout above 0.04313 could extend to 0.072 (previous structural high).
Confirmation signals: Bullish candlestick patterns (hammer / engulfing) within the support zone would strengthen the bullish case.
---
Bearish Scenario (Breakdown Risk)
Trigger: A strong daily close below 0.023 with high selling volume.
Implication: The mid-term bullish structure fails, pushing PENGU back into a downtrend.
Targets: Deeper corrections toward historical demand zones around 0.020 → 0.015 → 0.012.
Distribution signs: A series of lower highs followed by a confirmed range breakdown.
---
Market Psychology
Buyers are defending the 0.023–0.030 zone, signaling potential accumulation.
Sellers are waiting for breakdown confirmation below support to trigger panic selling.
This is a make-or-break moment for PENGU — a classic battleground between bulls and bears.
---
Conclusion
The 0.023–0.030 zone is the decisive level for PENGU’s next big move.
Bullish if it holds → targets at 0.0379 → 0.04313 → 0.072.
Bearish if it breaks down <0.023 → opens the door to deeper corrections.
Best approach: Wait for confirmation (daily close + volume) before committing to aggressive positions.
---
#PENGU #PudgyPenguins #Crypto #Altcoins #TA #TechnicalAnalysis #CryptoTrading #PriceAction
✅ Get Free Signals! Join Our Telegram Channel Here: t.me/TheCryptoNuclear
✅ Twitter: twitter.com/crypto_nuclear
✅ Join Bybit : partner.bybit.com/b/nuclearvip
✅ Benefits : Lifetime Trading Fee Discount -50%
✅ Twitter: twitter.com/crypto_nuclear
✅ Join Bybit : partner.bybit.com/b/nuclearvip
✅ Benefits : Lifetime Trading Fee Discount -50%
إخلاء المسؤولية
لا يُقصد بالمعلومات والمنشورات أن تكون، أو تشكل، أي نصيحة مالية أو استثمارية أو تجارية أو أنواع أخرى من النصائح أو التوصيات المقدمة أو المعتمدة من TradingView. اقرأ المزيد في شروط الاستخدام.