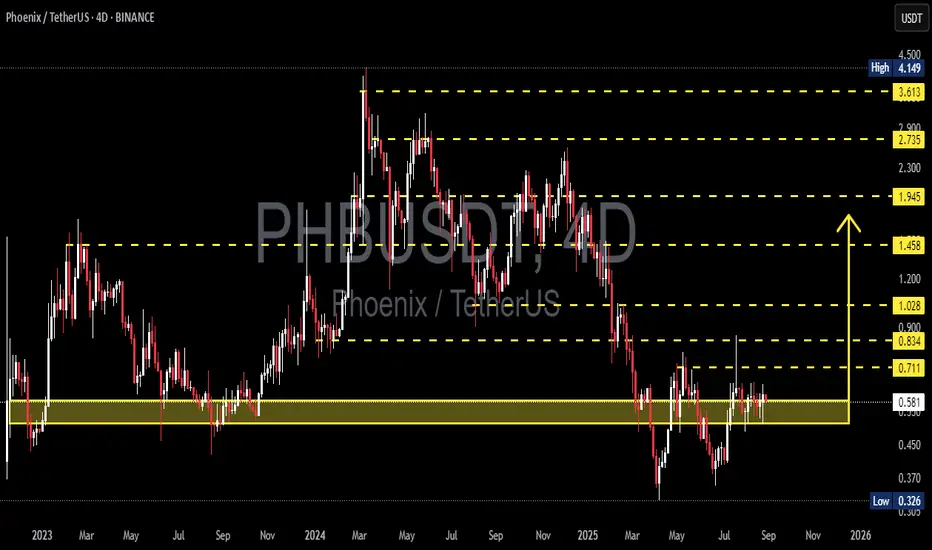
Currently, PHB/USDT is consolidating within a critical demand zone at 0.52 – 0.62. This area has repeatedly acted as a strong floor since 2023, absorbing heavy sell-offs and showing signs of accumulation.
The market structure suggests that PHB is forming a range-base accumulation pattern, with 0.711 as the immediate breakout trigger. The next move will decide whether PHB transitions into a bullish expansion or breaks down into deeper bearish territory.
---
🔹 Structure & Price Pattern
Demand zone (0.52 – 0.62): A key support level where buyers continue to defend strongly.
Cluster highs near 0.711: A liquidity level and breakout confirmation point.
Layered resistances above: 0.834 → 1.028 → 1.458 → 1.945, serving as potential take-profit zones.
Deep wicks to 0.326 in the past: Indicate capitulation events, followed by strong reclaim — a bullish sign as long as demand holds.
---
🟢 Bullish Scenario
If PHB closes above 0.711 (4D candle) with volume confirmation, a breakout rally may follow.
Upside targets:
1. 0.834 (minor resistance)
2. 1.028 (psychological resistance)
3. 1.458 (major resistance, strong take-profit area)
A confirmed breakout signals the end of long consolidation and a possible start of a bullish phase.
---
🔴 Bearish Scenario
Failure to break 0.60–0.62 / 0.711 may push PHB back toward 0.55 – 0.52.
If 0.52 breaks on a 4D close, PHB risks a deeper drop toward:
1. 0.50
2. 0.45
3. 0.37 – 0.326 (historical low)
A breakdown below 0.52 would confirm that buyers lost control, re-opening a bearish trend.
---
📌 Trading Strategy & Risk Management
Swing traders: Consider long entries near 0.55–0.58 with targets at 0.711+.
Breakout traders: Wait for a confirmed close above 0.711 before entering, targeting resistances above.
Stop loss: Below 0.52 to protect against deeper downside.
Maintain a Risk:Reward ratio ≥ 1:2 and use 4D candle closes for confirmation to avoid fakeouts.
---
✨ Conclusion
PHB is at a make-or-break level:
Holding above 0.52–0.62 keeps bullish momentum alive, with breakout potential toward 0.834–1.458.
Losing this demand zone could open the path back to 0.37–0.326 lows.
This is a critical crossroads — a breakout could mark the start of a new bullish cycle, while a breakdown signals renewed weakness.
#PHBUSDT #PHB #Phoenix #CryptoAnalysis #PriceAction #AltcoinAnalysis #CryptoTrading #SupportResistance #DemandZone #Breakout #BullishScenario #BearishScenario #SwingTrading
✅ Get Free Signals! Join Our Telegram Channel Here: t.me/TheCryptoNuclear
✅ Twitter: twitter.com/crypto_nuclear
✅ Join Bybit : partner.bybit.com/b/nuclearvip
✅ Benefits : Lifetime Trading Fee Discount -50%
✅ Twitter: twitter.com/crypto_nuclear
✅ Join Bybit : partner.bybit.com/b/nuclearvip
✅ Benefits : Lifetime Trading Fee Discount -50%
إخلاء المسؤولية
لا يُقصد بالمعلومات والمنشورات أن تكون، أو تشكل، أي نصيحة مالية أو استثمارية أو تجارية أو أنواع أخرى من النصائح أو التوصيات المقدمة أو المعتمدة من TradingView. اقرأ المزيد في شروط الاستخدام.