What is a fractal mathmatically?
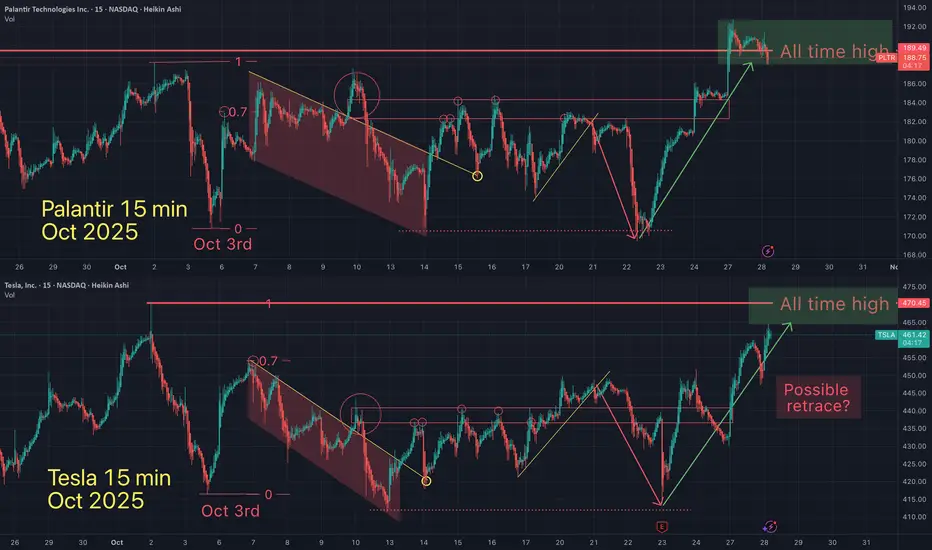
All asset charts are graphs, governed by coordinates on an x-axis and y-axis "chart". Where there exist trendlines that price action "respects". These trendlines and ratios are dictated by equations with several variables. If variables were by definition "random", then what would be the chance of 1 fractal appearing in a random assortment of buyers and sellers, in all different time zones (and countries)... all buyin in different amounts...at different times...
Regardless the fractal seems to remain intact.
May the trends be with you.
إخلاء المسؤولية
لا يُقصد بالمعلومات والمنشورات أن تكون، أو تشكل، أي نصيحة مالية أو استثمارية أو تجارية أو أنواع أخرى من النصائح أو التوصيات المقدمة أو المعتمدة من TradingView. اقرأ المزيد في شروط الاستخدام.
May the trends be with you.
إخلاء المسؤولية
لا يُقصد بالمعلومات والمنشورات أن تكون، أو تشكل، أي نصيحة مالية أو استثمارية أو تجارية أو أنواع أخرى من النصائح أو التوصيات المقدمة أو المعتمدة من TradingView. اقرأ المزيد في شروط الاستخدام.