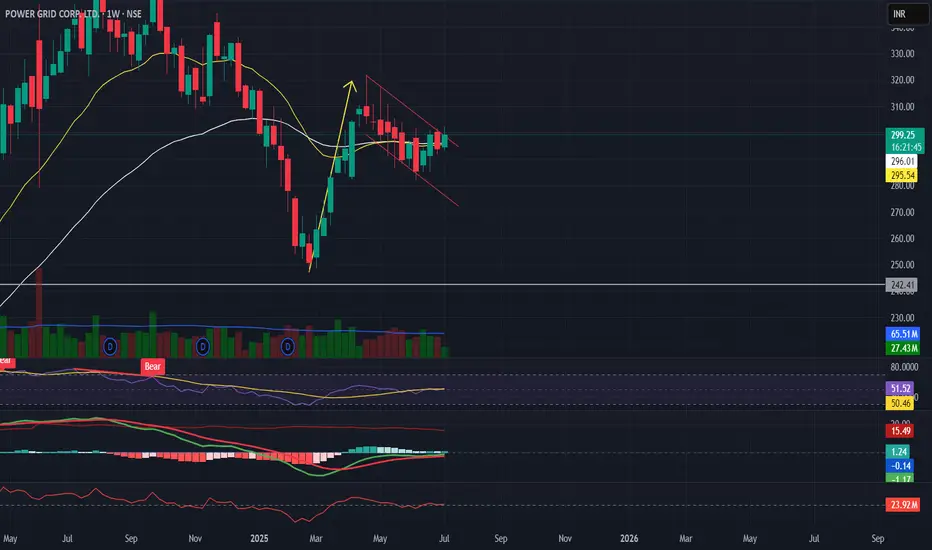
Power Grid – Breakout Plan
Watching for a clean move above ₹300 level.
Hourly chart shows Cup & Handle formation, while Daily/Weekly has Flag pattern attempting breakout.
✅ Breakout level: ₹300 (confirmation close needed)
✅ Stop-loss: ₹290–294 (below support / ATR-based)
✅ Target 1: ₹328 (Fibonacci 0.618 – Golden Ratio)
✅ Target 2: ₹375 (Measured Move)
Indicators:
EMAs rising on hourly, steady on daily.
RSI strong but nearing overbought on lower timeframe.
MACD positive momentum.
Watching volume for confirmation.
Macro Drivers:
Government infra spending.
Cooling inflation.
Rising electricity demand in India.
✅ Plan: Wait for confirmed breakout with volume. Strict risk management with pre-defined stop.
إخلاء المسؤولية
لا يُقصد بالمعلومات والمنشورات أن تكون، أو تشكل، أي نصيحة مالية أو استثمارية أو تجارية أو أنواع أخرى من النصائح أو التوصيات المقدمة أو المعتمدة من TradingView. اقرأ المزيد في شروط الاستخدام.
إخلاء المسؤولية
لا يُقصد بالمعلومات والمنشورات أن تكون، أو تشكل، أي نصيحة مالية أو استثمارية أو تجارية أو أنواع أخرى من النصائح أو التوصيات المقدمة أو المعتمدة من TradingView. اقرأ المزيد في شروط الاستخدام.