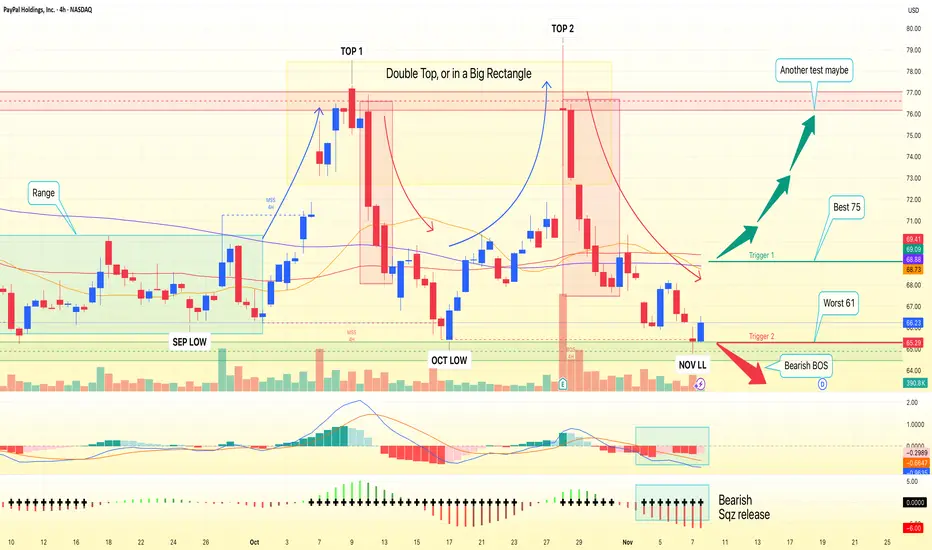
PYPL on the 1D chart remains a textbook rectangle, coiling after months of sideways trade. Price is back at the lower boundary near $65.50 with short-term momentum tilted bearish and all key MAs overhead. The MA20/60/120 are tightly clustered around $68.57–$70.63, reinforcing a heavy supply band. Volatility has contracted after October’s spike, so a decisive move from this squeeze looks close.
Primary path: neutral-to-range bias with a tactical bounce off the $65.50–$66.50 demand zone. A daily close back above the MA20 (≈$68.60) would be the first tell, while a daily close >$68.90 strengthens the case for a push into the $69.00–$70.50 cluster and a retest of $75.00. A sustained break and hold above $75.00 would transition the structure toward a fresh up-leg.
Alternative: failure at support. A decisive daily close <$65.20 would confirm a range breakdown and open $61.00. For positioning, keep the line in the sand tight: long ideas are invalid below $64.70; short ideas lose edge above $79.50. Until a break, respect the range—fade extremes and be disciplined with size, as volume on any breakout should be the confirmation cue.
This is a study, not financial advice. Manage risk and invalidations
ملاحظة
🎁 Please hit the like button and🎁 Leave a comment to support my work!
follow my X 👉 x.com/bbqgio
🔥 level up your Stock, FX, & Crypto: VIP access to AI technical analysis and pro market insights at TradeOS 👉
ai.tradeos.xyz/?utm_source=tvbg
🔥 level up your Stock, FX, & Crypto: VIP access to AI technical analysis and pro market insights at TradeOS 👉
ai.tradeos.xyz/?utm_source=tvbg
إخلاء المسؤولية
لا يُقصد بالمعلومات والمنشورات أن تكون، أو تشكل، أي نصيحة مالية أو استثمارية أو تجارية أو أنواع أخرى من النصائح أو التوصيات المقدمة أو المعتمدة من TradingView. اقرأ المزيد في شروط الاستخدام.