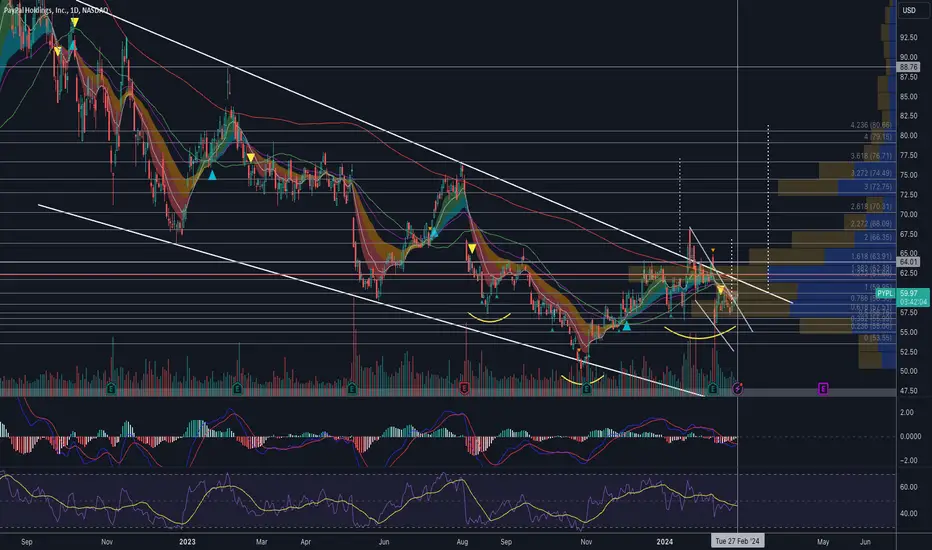
There are multiple patterns at play:
✅Inverse head and shoulder
✅Multi-year descending wedge
✅Near-term descending wedge breakout
The $60 to $64 area would be a critical resistance area, as it is the area where multiple factors are working against the bulls:
✅POC volume profile resistance
✅50 DMA
✅200 DMA
✅Wedge trendline resistance.
So if the bulls can clear that resistance area, the stock can run to as high as $80 area.
Here are upside targets:
$62.50 - $64
$66
$72
$80
Downside risk:
$53
I am not a licensed professional. None of the posts that I published are investment advice. Do your own research.
إخلاء المسؤولية
لا يُقصد بالمعلومات والمنشورات أن تكون، أو تشكل، أي نصيحة مالية أو استثمارية أو تجارية أو أنواع أخرى من النصائح أو التوصيات المقدمة أو المعتمدة من TradingView. اقرأ المزيد في شروط الاستخدام.