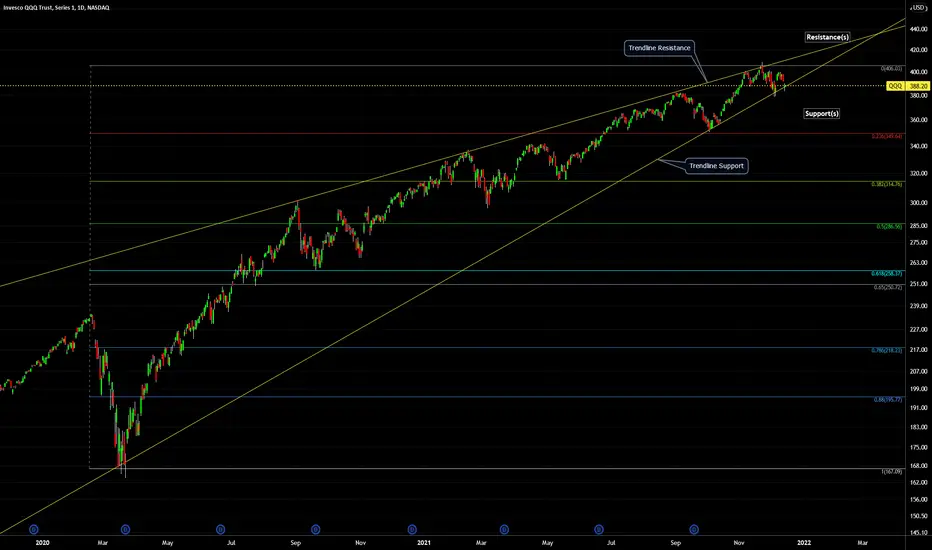
QQQ (Nasdaq ETF) - Support, Resistance, Trendlines - 2021- Daily:
Price Pattern: potential Head-and-Shoulders.
-Resistance Price Levels (colored horizontal lines above current price)
-Support Price Levels (colored horizontal lines below current price)
-Trendline Resistance (diagonal yellow lines above current price)
-Trendline Support (diagonal yellow lines below current price)
note: chart is on log scale.
Follow Me on TradingView, Youtube, X, Instagram.
Social Media links are in my profile.
Boost, comment, share to support.
All posts are not financial advice.
Social Media links are in my profile.
Boost, comment, share to support.
All posts are not financial advice.
إخلاء المسؤولية
لا يُقصد بالمعلومات والمنشورات أن تكون، أو تشكل، أي نصيحة مالية أو استثمارية أو تجارية أو أنواع أخرى من النصائح أو التوصيات المقدمة أو المعتمدة من TradingView. اقرأ المزيد في شروط الاستخدام.