QuantumScape’s Cobra Milestone Ignites Hype — But Looming Dilution and Scaling Risks Could Stall the Rally
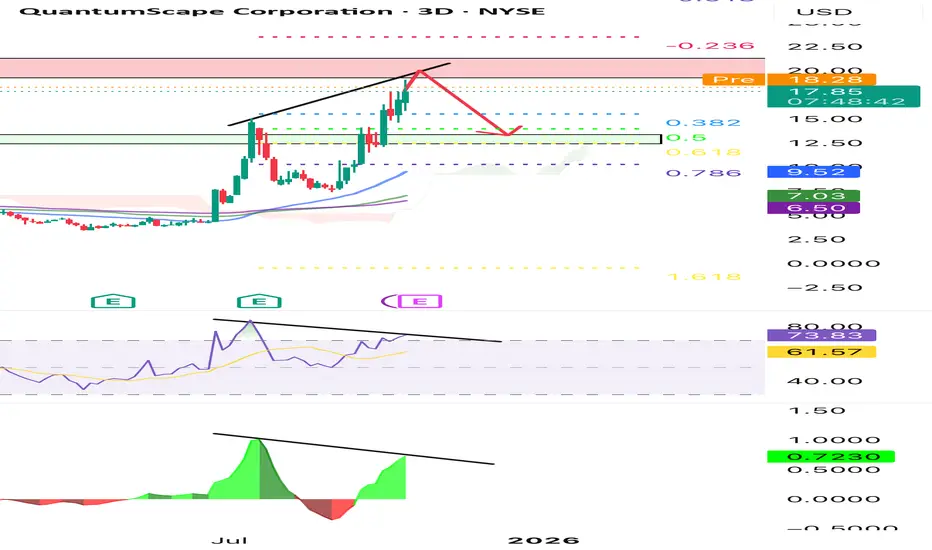
QuantumScape is testing a key resistance zone between $18–$20, where price action shows clear signs of momentum weakening. Both the RSI and MACD histogram display bearish divergence, signaling a potential exhaustion of the current rally as price prints higher highs while momentum forms lower highs.
The Fibonacci retracement levels highlight strong support near the 0.5–0.618 zone ($13.5–$11), aligning with the previous consolidation range and the cloud base area. A correction toward this zone would represent a healthy retest of broken structure and offer a potential re-accumulation point.
As long as price fails to close decisively above $20, the probability favors a pullback toward $14–$12, before any continuation of the broader uptrend.
إخلاء المسؤولية
لا يُقصد بالمعلومات والمنشورات أن تكون، أو تشكل، أي نصيحة مالية أو استثمارية أو تجارية أو أنواع أخرى من النصائح أو التوصيات المقدمة أو المعتمدة من TradingView. اقرأ المزيد في شروط الاستخدام.
إخلاء المسؤولية
لا يُقصد بالمعلومات والمنشورات أن تكون، أو تشكل، أي نصيحة مالية أو استثمارية أو تجارية أو أنواع أخرى من النصائح أو التوصيات المقدمة أو المعتمدة من TradingView. اقرأ المزيد في شروط الاستخدام.