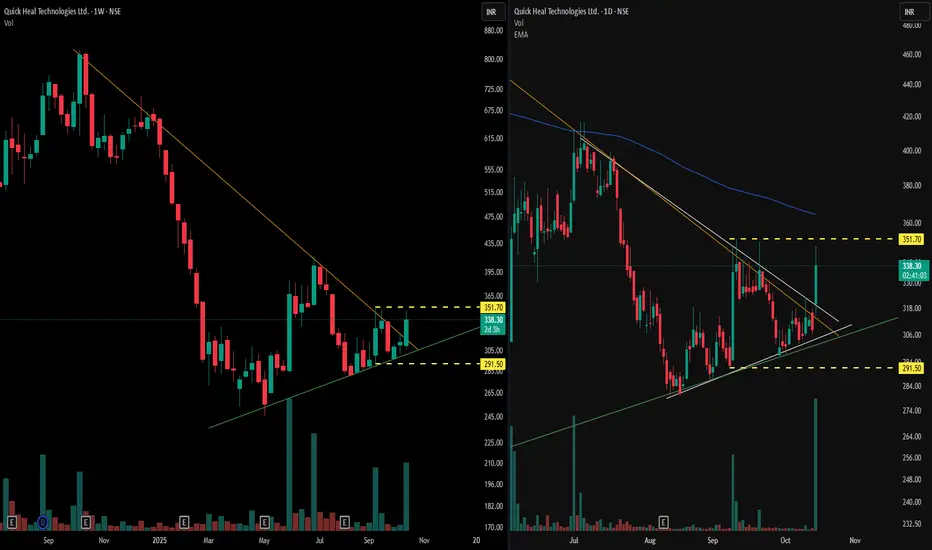
📊 Weekly Time Frame Observations (left panel)
- It displays a visible pattern contraction structure, specifically a Volatility Contraction Pattern (VCP), formed over multiple months
- An orange trendline marking the descending resistance, and a green line depicting the rising support, which together highlight the range contraction of price
- Volume spikes coincide with specific price responses at these zones, denoting heightened activity during volatility periods within the VCP
📈 Daily Time Frame Observations (right panel)
- Presents a more compressed Volatility Contraction Pattern (VCP), mirroring the broader weekly setup but over a shorter time span.
- Below the blue 200-day exponential moving average
❗ Disclaimer: The above post is strictly observational and does not constitute any trading advice or predictions regarding breakout or price direction.
🎯 Master My Self-Made Trading Strategy
📈 Telegram (Learn Today): t.me/hashtaghammer
✅ WhatsApp (Learn Today): wa.me/919455664601
📈 Telegram (Learn Today): t.me/hashtaghammer
✅ WhatsApp (Learn Today): wa.me/919455664601
منشورات ذات صلة
إخلاء المسؤولية
لا يُقصد بالمعلومات والمنشورات أن تكون، أو تشكل، أي نصيحة مالية أو استثمارية أو تجارية أو أنواع أخرى من النصائح أو التوصيات المقدمة أو المعتمدة من TradingView. اقرأ المزيد في شروط الاستخدام.