RACL Geartech Ltd – Trendline Breakout with Volume Confirmation! 🚀🔥
📅 Date: April 12, 2025
📊 Chart Overview:
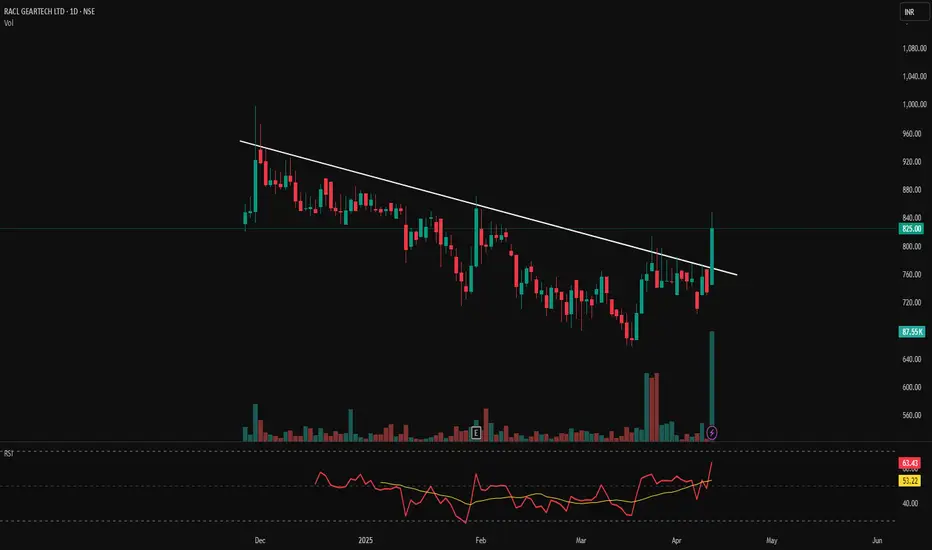
RACL Geartech has shown a strong bullish breakout above a long-standing descending trendline resistance, backed by a massive volume surge—a classic breakout confirmation signal.
📌 Key Levels:
📈 Breakout Level (Previous Resistance): ₹760
✅ New Support: ₹760
🔼 Resistance Zones Ahead: ₹860 ➡️ ₹900 ➡️ ₹950
⚠️ Stop-loss for Swing Position: ₹740 (below breakout + trendline)
📈 Technical Indicators:
📊 Volume Spike: Today’s volume (87.5K) is significantly higher than the recent average, indicating strong buying interest.
📉 RSI (Relative Strength Index): At 63.43, showing positive momentum with potential room before entering overbought territory.
📉 MACD-like indicator (yellow line vs red line crossover): Clear upward crossover—bullish shift in momentum.
📏 Trendline drawn from December 2024 highs to recent lower highs—now convincingly broken.
🧠 Trade Strategy:
🎯 Consider buying on dips near ₹770–₹785 if retest occurs.
🛡 SL: ₹740
🎯 Targets: ₹860 ➡️ ₹900 ➡️ ₹950
📌 Disclaimer: This chart is for educational and analytical purposes. Always conduct your own analysis or consult a registered financial advisor before taking any trading/investment decision.
📅 Date: April 12, 2025
📊 Chart Overview:
RACL Geartech has shown a strong bullish breakout above a long-standing descending trendline resistance, backed by a massive volume surge—a classic breakout confirmation signal.
📌 Key Levels:
📈 Breakout Level (Previous Resistance): ₹760
✅ New Support: ₹760
🔼 Resistance Zones Ahead: ₹860 ➡️ ₹900 ➡️ ₹950
⚠️ Stop-loss for Swing Position: ₹740 (below breakout + trendline)
📈 Technical Indicators:
📊 Volume Spike: Today’s volume (87.5K) is significantly higher than the recent average, indicating strong buying interest.
📉 RSI (Relative Strength Index): At 63.43, showing positive momentum with potential room before entering overbought territory.
📉 MACD-like indicator (yellow line vs red line crossover): Clear upward crossover—bullish shift in momentum.
📏 Trendline drawn from December 2024 highs to recent lower highs—now convincingly broken.
🧠 Trade Strategy:
🎯 Consider buying on dips near ₹770–₹785 if retest occurs.
🛡 SL: ₹740
🎯 Targets: ₹860 ➡️ ₹900 ➡️ ₹950
📌 Disclaimer: This chart is for educational and analytical purposes. Always conduct your own analysis or consult a registered financial advisor before taking any trading/investment decision.
إخلاء المسؤولية
لا يُقصد بالمعلومات والمنشورات أن تكون، أو تشكل، أي نصيحة مالية أو استثمارية أو تجارية أو أنواع أخرى من النصائح أو التوصيات المقدمة أو المعتمدة من TradingView. اقرأ المزيد في شروط الاستخدام.
إخلاء المسؤولية
لا يُقصد بالمعلومات والمنشورات أن تكون، أو تشكل، أي نصيحة مالية أو استثمارية أو تجارية أو أنواع أخرى من النصائح أو التوصيات المقدمة أو المعتمدة من TradingView. اقرأ المزيد في شروط الاستخدام.