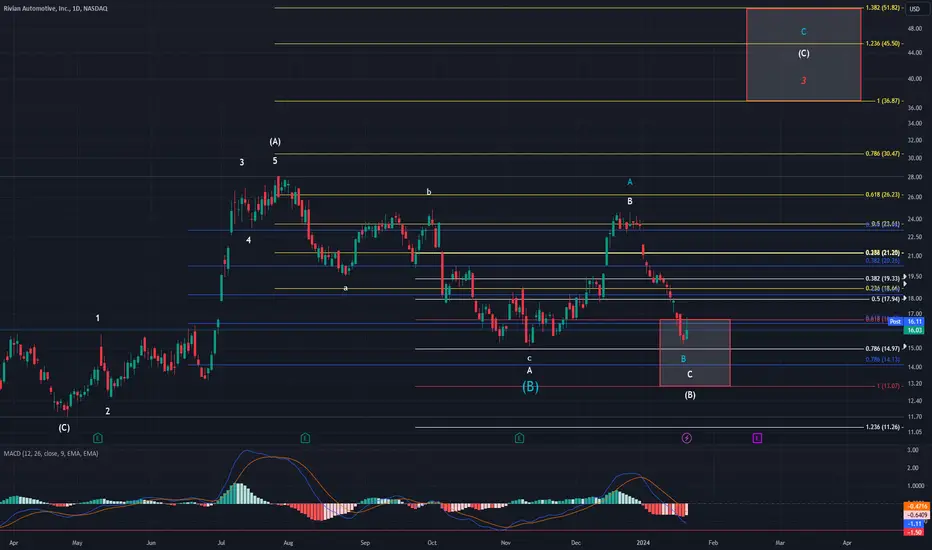
Today was a good start but nothing is confirmed yet. We raised strong early in the day and then spent the remainder meandering down. I had mentioned in a comment that we needed to watch the 0.618 fib @ $16.65 as a possible resistance level. Well, as you can see on the 3min chart at the bottom, we smacked into it and then got rejected. I was hoping we would drop no lower than $16.11 which would have meant it was a mini wave 4 in a micro-1. The fact that we did drop lower means this was either all a mini-wave 1 or mini-c-wave higher in wave iv of C of (B). What does that mean? It means we didn't get any concrete answers today. This retrace could have been a function of either my primary or ALT. As I said, this was a good start though. The reason I say that is how high the MACD rose on the 3min chart below. The strength that it showed is very promising the bottom is in. Price also carved out a bottom on pos div. which is needed to have a trend change.
On the main chart above, MACD looks to be starting to curve higher. I expected today to be green if you recall from yesterday's post. Rivian needed a green day to get the daily MACD to start changing direction. Should tomorrow be red again, MACD will once again be in danger of creating a new low on the daily. If it crosses my red line, then that suggests Rivian is in some serious trouble. I have my stop still in place for $15.50, because I feel if we drop below that, there is a very good chance price will fall all the way to the $13 area.
If this has all be the a-b waves of iv then the clues will be in MACD. If it at any time MACD creates a high above todays on the 3min chart, that will be a clue that the bottom is in. If price makes a new high and begins to fall without MACD making a new high that leads credence to a wave iv. I'm hoping tomorrow we finally find out for sure. I will be watching for us to breach the $17.12 high within the next couple days.
ملاحظة
It looks to me that there are two possibilities for this price action. We either carved out a leading diagonal, or this is an abc destined for lower prices. I think the answer is coming soon.Go to ewtdaily.com for DETAILED DAILY UPDATES on 27 unique tickers and a daily zoom call with members to discuss latest analysis and get a 7-day FREE trial
Bonam Fortunam,
--Tyler
Bonam Fortunam,
--Tyler
منشورات ذات صلة
إخلاء المسؤولية
لا يُقصد بالمعلومات والمنشورات أن تكون، أو تشكل، أي نصيحة مالية أو استثمارية أو تجارية أو أنواع أخرى من النصائح أو التوصيات المقدمة أو المعتمدة من TradingView. اقرأ المزيد في شروط الاستخدام.
Go to ewtdaily.com for DETAILED DAILY UPDATES on 27 unique tickers and a daily zoom call with members to discuss latest analysis and get a 7-day FREE trial
Bonam Fortunam,
--Tyler
Bonam Fortunam,
--Tyler
منشورات ذات صلة
إخلاء المسؤولية
لا يُقصد بالمعلومات والمنشورات أن تكون، أو تشكل، أي نصيحة مالية أو استثمارية أو تجارية أو أنواع أخرى من النصائح أو التوصيات المقدمة أو المعتمدة من TradingView. اقرأ المزيد في شروط الاستخدام.