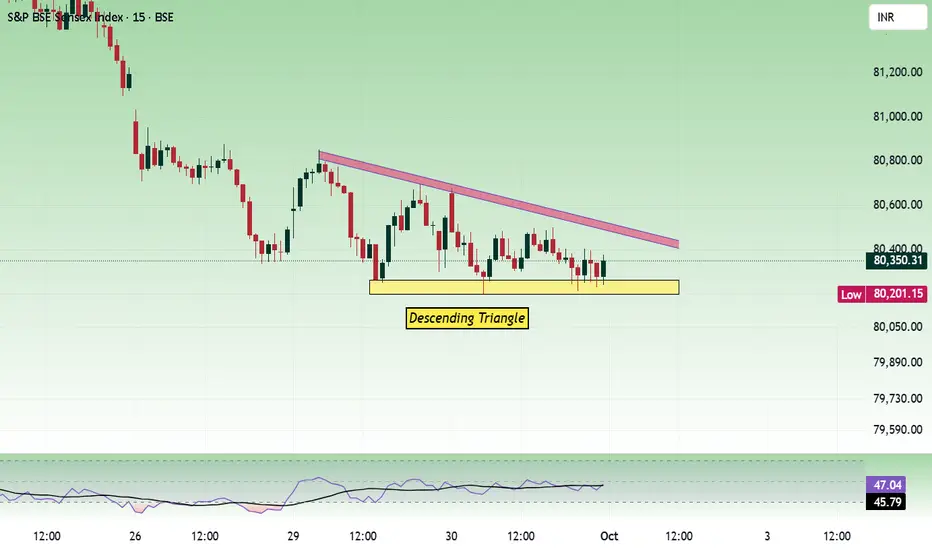
For the past two days, the price has been moving within the range of 80200 to 80800. And today's movement has formed a triangle pattern. Unless the range is broken, the movement can be choppy. Nearby support is seen at 80000. If 80k is broken, the next support is at the 79750 to 79820 zone.
Buy above 80320 with a stop-loss of 80200 for targets of 80400, 80520, 80640, 80760, and 80880.
Sell below 79960 with a stop-loss of 80100 for the targets 79840, 79760, 79640, 79520, 79400, and 79240.
If the price does not gain strength, we can expect a range move between 80k and 80700.
Buy above 80320 with a stop-loss of 80200 for targets of 80400, 80520, 80640, 80760, and 80880.
Sell below 79960 with a stop-loss of 80100 for the targets 79840, 79760, 79640, 79520, 79400, and 79240.
If the price does not gain strength, we can expect a range move between 80k and 80700.
ملاحظة
Facing triangle trendline resistance. تم فتح الصفقة
Long.أغلقت الصفقة: تم الوصول للهدف
Targets done. Role I play here : Moderator. Follow me in telegram to trade better. t.me/Analysis4Newbie Contact information : tradingplan4u@gmail.com
إخلاء المسؤولية
لا يُقصد بالمعلومات والمنشورات أن تكون، أو تشكل، أي نصيحة مالية أو استثمارية أو تجارية أو أنواع أخرى من النصائح أو التوصيات المقدمة أو المعتمدة من TradingView. اقرأ المزيد في شروط الاستخدام.
Role I play here : Moderator. Follow me in telegram to trade better. t.me/Analysis4Newbie Contact information : tradingplan4u@gmail.com
إخلاء المسؤولية
لا يُقصد بالمعلومات والمنشورات أن تكون، أو تشكل، أي نصيحة مالية أو استثمارية أو تجارية أو أنواع أخرى من النصائح أو التوصيات المقدمة أو المعتمدة من TradingView. اقرأ المزيد في شروط الاستخدام.