Detailed Market Structure Breakdown
4-Hour Chart (Macro Trend)
Structure: The Sensex is in a Strong Bullish Momentum phase. The price successfully consolidated Monday's gains and is trading comfortably within a well-defined ascending channel. The market is poised to challenge the high set last week (85,290).
Key Levels:
Major Supply (Resistance): 85,300 - 85,600. This area (the recent high and the upper channel boundary) is the immediate overhead hurdle. A decisive breakout above 85,600 is needed to challenge the All-Time High of 85,978.
Major Demand (Support): 84,400 - 84,600. This area, which includes the lower channel trendline and a key FVG (Fair Value Gap), is the must-hold zone for the short-term uptrend.
Outlook: The short-term bias is Strongly Bullish. The market is set for a high-volatility session as it attempts to break the resistance.
1-Hour Chart (Intermediate View)
Structure: The 1H chart shows classic bullish continuation. The price is making higher highs and higher lows, and the close was near the upper boundary of the channel. The structure shows high buying conviction.
Key Levels:
Immediate Resistance: 85,300.
Immediate Support: 84,600 (Recent swing low/lower channel boundary).
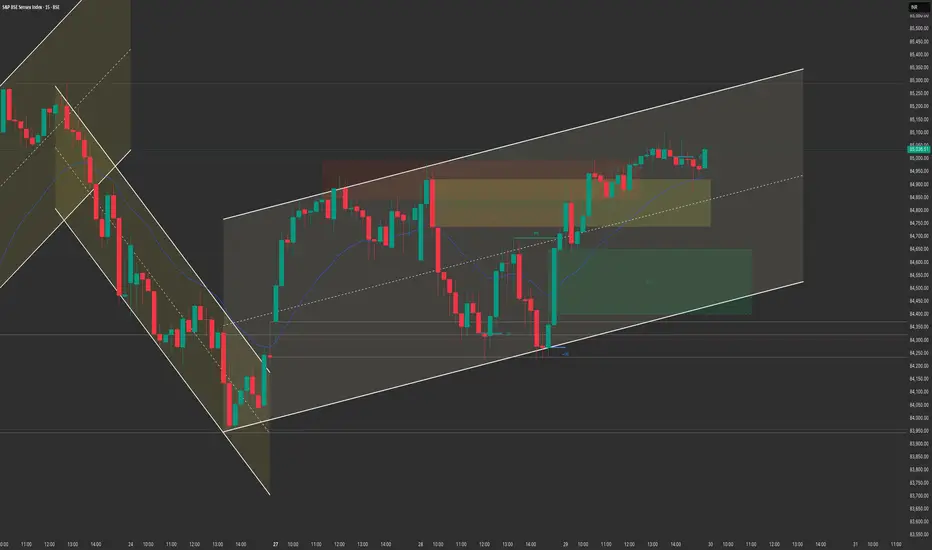
15-Minute Chart (Intraday View)
Structure: The 15M chart confirms the strong continuation. The price is trading above its key moving averages and within a tight, ascending channel. The momentum is favorable for a morning breakout attempt.
Key Levels:
Intraday Supply: 85,300.
Intraday Demand: 84,800 (Recent consolidation support).
Outlook: Aggressively Bullish.
📈 Structure Analysis & Trade Plan: 30th October
Market Outlook: Sensex is bullish and poised to challenge its recent high. The US Fed decision today is the primary risk factor and could trigger a massive volatility event.
Bullish Scenario (Primary Plan: Continuation/Breakout)
Justification: The strong technical structure and tight consolidation right below the high favor a breakout.
Entry: Long entry on a decisive break and 15-minute candle close above 85,300. Alternatively, look for a dip entry near 84,600 - 84,800 (the key support zone).
Stop Loss (SL): Place a stop loss below 84,400 (below the lower channel trendline/major support).
Targets:
T1: 85,600 (Upper channel boundary).
T2: 85,978 (All-Time High retest).
Bearish Scenario (Counter-Trend/Reversal)
Justification: High-risk. Only valid if the Fed decision is highly hawkish, causing a sharp rejection from the 85,300 zone.
Trigger: A sustained break and 1-hour close back below 84,400 (breaking the channel support).
Entry: Short entry below 84,400.
Stop Loss (SL): Above 84,800.
Targets:
T1: 84,000 (Psychological support).
T2: 83,600 (Major FVG support).
Key Levels for Observation:
Immediate Decision Point: 84,800 - 85,300 zone.
Bullish Confirmation: Sustained trade above 85,300.
Bearish Warning: A move below 84,400.
Line in the Sand: 84,400.
Crucial Event: US Federal Reserve policy meeting outcome (post-market hours, will affect volatility).
4-Hour Chart (Macro Trend)
Structure: The Sensex is in a Strong Bullish Momentum phase. The price successfully consolidated Monday's gains and is trading comfortably within a well-defined ascending channel. The market is poised to challenge the high set last week (85,290).
Key Levels:
Major Supply (Resistance): 85,300 - 85,600. This area (the recent high and the upper channel boundary) is the immediate overhead hurdle. A decisive breakout above 85,600 is needed to challenge the All-Time High of 85,978.
Major Demand (Support): 84,400 - 84,600. This area, which includes the lower channel trendline and a key FVG (Fair Value Gap), is the must-hold zone for the short-term uptrend.
Outlook: The short-term bias is Strongly Bullish. The market is set for a high-volatility session as it attempts to break the resistance.
1-Hour Chart (Intermediate View)
Structure: The 1H chart shows classic bullish continuation. The price is making higher highs and higher lows, and the close was near the upper boundary of the channel. The structure shows high buying conviction.
Key Levels:
Immediate Resistance: 85,300.
Immediate Support: 84,600 (Recent swing low/lower channel boundary).
15-Minute Chart (Intraday View)
Structure: The 15M chart confirms the strong continuation. The price is trading above its key moving averages and within a tight, ascending channel. The momentum is favorable for a morning breakout attempt.
Key Levels:
Intraday Supply: 85,300.
Intraday Demand: 84,800 (Recent consolidation support).
Outlook: Aggressively Bullish.
📈 Structure Analysis & Trade Plan: 30th October
Market Outlook: Sensex is bullish and poised to challenge its recent high. The US Fed decision today is the primary risk factor and could trigger a massive volatility event.
Bullish Scenario (Primary Plan: Continuation/Breakout)
Justification: The strong technical structure and tight consolidation right below the high favor a breakout.
Entry: Long entry on a decisive break and 15-minute candle close above 85,300. Alternatively, look for a dip entry near 84,600 - 84,800 (the key support zone).
Stop Loss (SL): Place a stop loss below 84,400 (below the lower channel trendline/major support).
Targets:
T1: 85,600 (Upper channel boundary).
T2: 85,978 (All-Time High retest).
Bearish Scenario (Counter-Trend/Reversal)
Justification: High-risk. Only valid if the Fed decision is highly hawkish, causing a sharp rejection from the 85,300 zone.
Trigger: A sustained break and 1-hour close back below 84,400 (breaking the channel support).
Entry: Short entry below 84,400.
Stop Loss (SL): Above 84,800.
Targets:
T1: 84,000 (Psychological support).
T2: 83,600 (Major FVG support).
Key Levels for Observation:
Immediate Decision Point: 84,800 - 85,300 zone.
Bullish Confirmation: Sustained trade above 85,300.
Bearish Warning: A move below 84,400.
Line in the Sand: 84,400.
Crucial Event: US Federal Reserve policy meeting outcome (post-market hours, will affect volatility).
إخلاء المسؤولية
لا يُقصد بالمعلومات والمنشورات أن تكون، أو تشكل، أي نصيحة مالية أو استثمارية أو تجارية أو أنواع أخرى من النصائح أو التوصيات المقدمة أو المعتمدة من TradingView. اقرأ المزيد في شروط الاستخدام.
إخلاء المسؤولية
لا يُقصد بالمعلومات والمنشورات أن تكون، أو تشكل، أي نصيحة مالية أو استثمارية أو تجارية أو أنواع أخرى من النصائح أو التوصيات المقدمة أو المعتمدة من TradingView. اقرأ المزيد في شروط الاستخدام.