🔎 Market Structure Analysis (Sensex)
4H Chart
Price is respecting the ascending channel and holding above the 80,800 level.
Immediate resistance lies at 81,200–81,300 zone (supply area + prior rejection).
Strong demand zone rests near 80,000–80,200, which has acted as a base for multiple rallies.
Bias: Sideways-to-bullish, as long as 80,800 holds.
1H Chart
Clear structure of higher lows being maintained since early September.
Price is consolidating just below 81,200 resistance with multiple rejections → a breakout here can trigger a sharp move toward 81,600–81,750.
Support clusters at 80,800 and 80,500 zones.
Market shows liquidity sweeps around supply, suggesting accumulation before expansion.
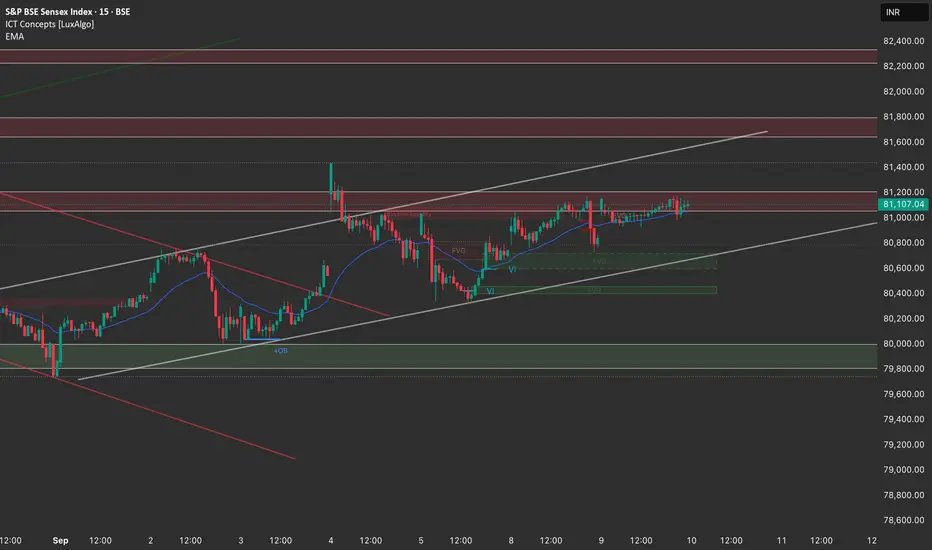
15M Chart
Price is compressing between 81,200 resistance and 80,900 support.
Minor FVG (Fair Value Gap) near 80,850–80,900, which could act as a magnet short-term.
If price sustains above 81,200, momentum buyers may enter.
Failure at 81,200 could bring a quick retest of 80,800–80,850.
📈 Trade Plan (10th September)
Bullish Scenario
Entry: On sustained breakout above 81,200 with good candle close (1H/15M confirmation).
Target 1: 81,600
Target 2: 81,750
Stop-loss: Below 81,000
Bearish Scenario
Entry: If price rejects 81,200 supply zone again and breaks below 80,900.
Target 1: 80,600
Target 2: 80,200
Stop-loss: Above 81,300
Neutral/Wait-and-Watch
If price remains stuck between 81,000–81,200, avoid trading → wait for breakout direction.
✅ Bias for 10th September:
Range-to-bullish bias unless 80,800 breaks.
Watch closely for breakout at 81,200; this level will decide whether we head higher or pull back.
4H Chart
Price is respecting the ascending channel and holding above the 80,800 level.
Immediate resistance lies at 81,200–81,300 zone (supply area + prior rejection).
Strong demand zone rests near 80,000–80,200, which has acted as a base for multiple rallies.
Bias: Sideways-to-bullish, as long as 80,800 holds.
1H Chart
Clear structure of higher lows being maintained since early September.
Price is consolidating just below 81,200 resistance with multiple rejections → a breakout here can trigger a sharp move toward 81,600–81,750.
Support clusters at 80,800 and 80,500 zones.
Market shows liquidity sweeps around supply, suggesting accumulation before expansion.
15M Chart
Price is compressing between 81,200 resistance and 80,900 support.
Minor FVG (Fair Value Gap) near 80,850–80,900, which could act as a magnet short-term.
If price sustains above 81,200, momentum buyers may enter.
Failure at 81,200 could bring a quick retest of 80,800–80,850.
📈 Trade Plan (10th September)
Bullish Scenario
Entry: On sustained breakout above 81,200 with good candle close (1H/15M confirmation).
Target 1: 81,600
Target 2: 81,750
Stop-loss: Below 81,000
Bearish Scenario
Entry: If price rejects 81,200 supply zone again and breaks below 80,900.
Target 1: 80,600
Target 2: 80,200
Stop-loss: Above 81,300
Neutral/Wait-and-Watch
If price remains stuck between 81,000–81,200, avoid trading → wait for breakout direction.
✅ Bias for 10th September:
Range-to-bullish bias unless 80,800 breaks.
Watch closely for breakout at 81,200; this level will decide whether we head higher or pull back.
إخلاء المسؤولية
لا يُقصد بالمعلومات والمنشورات أن تكون، أو تشكل، أي نصيحة مالية أو استثمارية أو تجارية أو أنواع أخرى من النصائح أو التوصيات المقدمة أو المعتمدة من TradingView. اقرأ المزيد في شروط الاستخدام.
إخلاء المسؤولية
لا يُقصد بالمعلومات والمنشورات أن تكون، أو تشكل، أي نصيحة مالية أو استثمارية أو تجارية أو أنواع أخرى من النصائح أو التوصيات المقدمة أو المعتمدة من TradingView. اقرأ المزيد في شروط الاستخدام.