4-Hour Chart (Macro Trend)
Structure: The Sensex has confirmed a Break of Structure (MSS) on the aggressive short-term momentum, breaking below the lower trendline of the steep ascending channel. The price has corrected deeply, with the final 4H candle closing as a large bearish candle.
Key Levels:
Major Supply (Resistance): 84,800 - 85,000. This area (the high from Friday and the FVG on the chart) is the immediate overhead resistance.
Major Demand (Support): 83,600 - 83,900. This area aligns with the lower trendline of the corrective pattern and the FVG (Fair Value Gap), making it the must-hold zone for the overall bullish structure [refer to charts].
Outlook: The bias is Corrective within an Uptrend. We expect the market to continue correcting towards the 83,600 - 83,900 support zone before finding significant buying interest.
1-Hour Chart (Intermediate View)
Structure: The 1H chart shows a clear breakdown from the steep ascending channel. The price is now trading within a newly formed descending channel (or a bearish flag), confirming the short-term correction.
Key Levels:
Immediate Resistance: 84,400 (Upper boundary of the descending channel/FVG).
Immediate Support: 83,800 - 84,000 (Lower channel boundary).
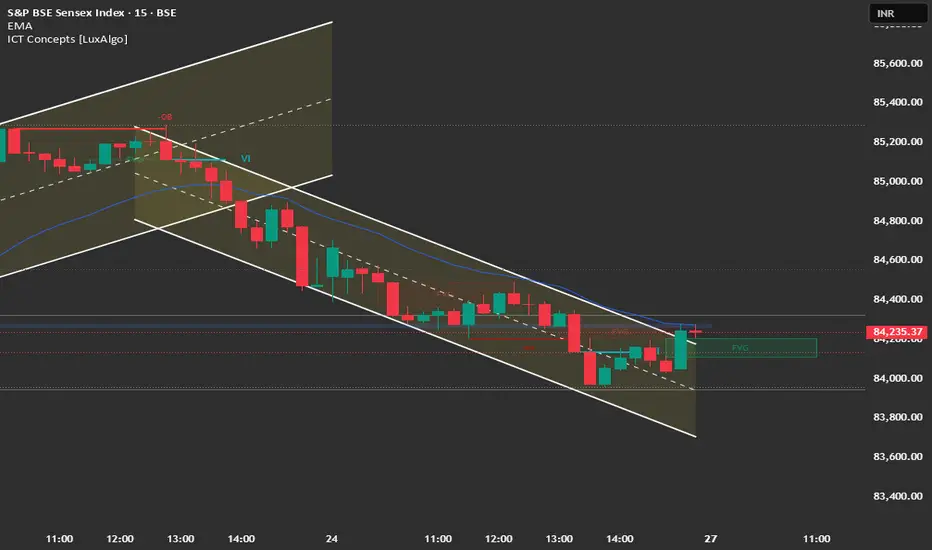
15-Minute Chart (Intraday View)
Structure: The 15M chart confirms the sharp descending channel and strong intraday bearish control. The final close was near the lows, indicating selling pressure remains.
Key Levels:
Intraday Supply: 84,400.
Intraday Demand: 83,800.
Outlook: Bearish for the session open. A "Sell on Rise" strategy is favorable.
📈 Structure Analysis & Trade Plan: 27th October
Market Outlook: Sensex is undergoing a short-term correction after hitting the 85,290 high, driven by renewed trade fears. The primary strategy is to sell the rally/breakdown or buy a major reversal at strong support.
Bearish Scenario (Primary Plan: Correction Continuation/Sell on Rise)
Justification: The sharp breakdown below the channel favors a deeper correction toward the major demand zone.
Entry: Short entry on a retest and rejection of the 84,400 - 84,600 zone (breakdown level/FVG) OR Short a decisive break and 15-minute candle close below 84,000.
Stop Loss (SL): Place a stop loss above 84,800 (above the last swing high/FVG).
Targets:
T1: 83,800 (Lower channel support).
T2: 83,600 (Major FVG support).
T3: 83,200 (Next major support).
Bullish Scenario (Counter-Trend/Reversal)
Justification: Only valid if strong buying emerges, likely on positive global or corporate news.
Trigger: A sustained move and close above 85,000.
Entry: Long entry on a confirmed 15-minute close above 85,000.
Stop Loss (SL): Below 84,500.
Targets:
T1: 85,290 (All-Time High retest).
T2: 85,600 (Extension target).
Key Levels for Observation:
Immediate Decision Point: 83,800 - 84,600 range.
Bearish Confirmation: Sustained trade below 84,000.
Bullish Warning: A move back above 84,800.
Line in the Sand: 83,600. A break below this level shifts the medium-term bias to a deeper corrective phase.
Structure: The Sensex has confirmed a Break of Structure (MSS) on the aggressive short-term momentum, breaking below the lower trendline of the steep ascending channel. The price has corrected deeply, with the final 4H candle closing as a large bearish candle.
Key Levels:
Major Supply (Resistance): 84,800 - 85,000. This area (the high from Friday and the FVG on the chart) is the immediate overhead resistance.
Major Demand (Support): 83,600 - 83,900. This area aligns with the lower trendline of the corrective pattern and the FVG (Fair Value Gap), making it the must-hold zone for the overall bullish structure [refer to charts].
Outlook: The bias is Corrective within an Uptrend. We expect the market to continue correcting towards the 83,600 - 83,900 support zone before finding significant buying interest.
1-Hour Chart (Intermediate View)
Structure: The 1H chart shows a clear breakdown from the steep ascending channel. The price is now trading within a newly formed descending channel (or a bearish flag), confirming the short-term correction.
Key Levels:
Immediate Resistance: 84,400 (Upper boundary of the descending channel/FVG).
Immediate Support: 83,800 - 84,000 (Lower channel boundary).
15-Minute Chart (Intraday View)
Structure: The 15M chart confirms the sharp descending channel and strong intraday bearish control. The final close was near the lows, indicating selling pressure remains.
Key Levels:
Intraday Supply: 84,400.
Intraday Demand: 83,800.
Outlook: Bearish for the session open. A "Sell on Rise" strategy is favorable.
📈 Structure Analysis & Trade Plan: 27th October
Market Outlook: Sensex is undergoing a short-term correction after hitting the 85,290 high, driven by renewed trade fears. The primary strategy is to sell the rally/breakdown or buy a major reversal at strong support.
Bearish Scenario (Primary Plan: Correction Continuation/Sell on Rise)
Justification: The sharp breakdown below the channel favors a deeper correction toward the major demand zone.
Entry: Short entry on a retest and rejection of the 84,400 - 84,600 zone (breakdown level/FVG) OR Short a decisive break and 15-minute candle close below 84,000.
Stop Loss (SL): Place a stop loss above 84,800 (above the last swing high/FVG).
Targets:
T1: 83,800 (Lower channel support).
T2: 83,600 (Major FVG support).
T3: 83,200 (Next major support).
Bullish Scenario (Counter-Trend/Reversal)
Justification: Only valid if strong buying emerges, likely on positive global or corporate news.
Trigger: A sustained move and close above 85,000.
Entry: Long entry on a confirmed 15-minute close above 85,000.
Stop Loss (SL): Below 84,500.
Targets:
T1: 85,290 (All-Time High retest).
T2: 85,600 (Extension target).
Key Levels for Observation:
Immediate Decision Point: 83,800 - 84,600 range.
Bearish Confirmation: Sustained trade below 84,000.
Bullish Warning: A move back above 84,800.
Line in the Sand: 83,600. A break below this level shifts the medium-term bias to a deeper corrective phase.
إخلاء المسؤولية
لا يُقصد بالمعلومات والمنشورات أن تكون، أو تشكل، أي نصيحة مالية أو استثمارية أو تجارية أو أنواع أخرى من النصائح أو التوصيات المقدمة أو المعتمدة من TradingView. اقرأ المزيد في شروط الاستخدام.
إخلاء المسؤولية
لا يُقصد بالمعلومات والمنشورات أن تكون، أو تشكل، أي نصيحة مالية أو استثمارية أو تجارية أو أنواع أخرى من النصائح أو التوصيات المقدمة أو المعتمدة من TradingView. اقرأ المزيد في شروط الاستخدام.