بيع
SHOP- rectangle pattern - short
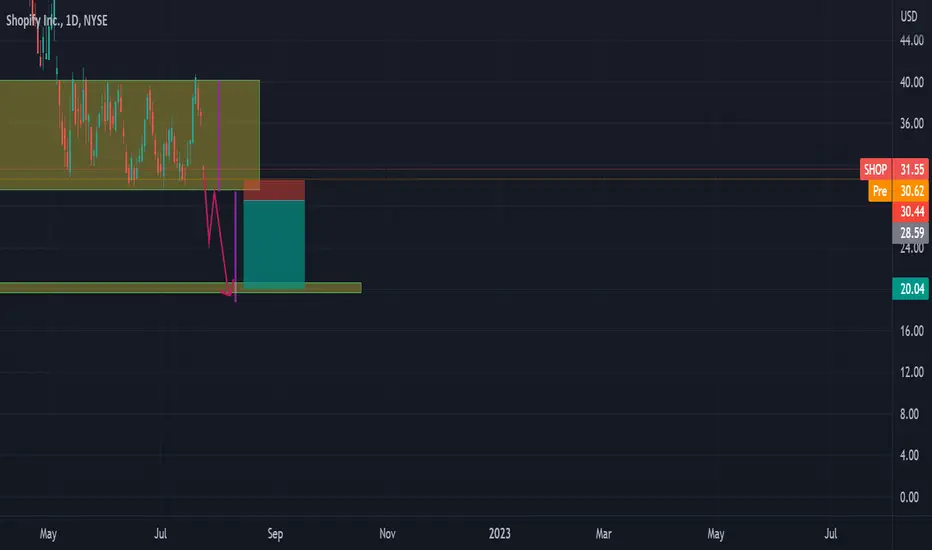
Shopify stock is in the range . It looks like the price is creating a rectangle pattern which may break to the downside.
Enter the trade if the price breaks below the rectangle and it retests the bottom of the rectangle as a resistance .
Target and the stop loss are shown in the chart.
Enter the trade if the price breaks below the rectangle and it retests the bottom of the rectangle as a resistance .
Target and the stop loss are shown in the chart.
💥 Free signals and ideas ➡ t.me/vfinvestment
إخلاء المسؤولية
لا يُقصد بالمعلومات والمنشورات أن تكون، أو تشكل، أي نصيحة مالية أو استثمارية أو تجارية أو أنواع أخرى من النصائح أو التوصيات المقدمة أو المعتمدة من TradingView. اقرأ المزيد في شروط الاستخدام.
💥 Free signals and ideas ➡ t.me/vfinvestment
إخلاء المسؤولية
لا يُقصد بالمعلومات والمنشورات أن تكون، أو تشكل، أي نصيحة مالية أو استثمارية أو تجارية أو أنواع أخرى من النصائح أو التوصيات المقدمة أو المعتمدة من TradingView. اقرأ المزيد في شروط الاستخدام.