Monthly timeframe Pink
Weekly = Grey
Daily = Red
4hr = Orange
1hr = Yellow
15min = Blue
5min = Green
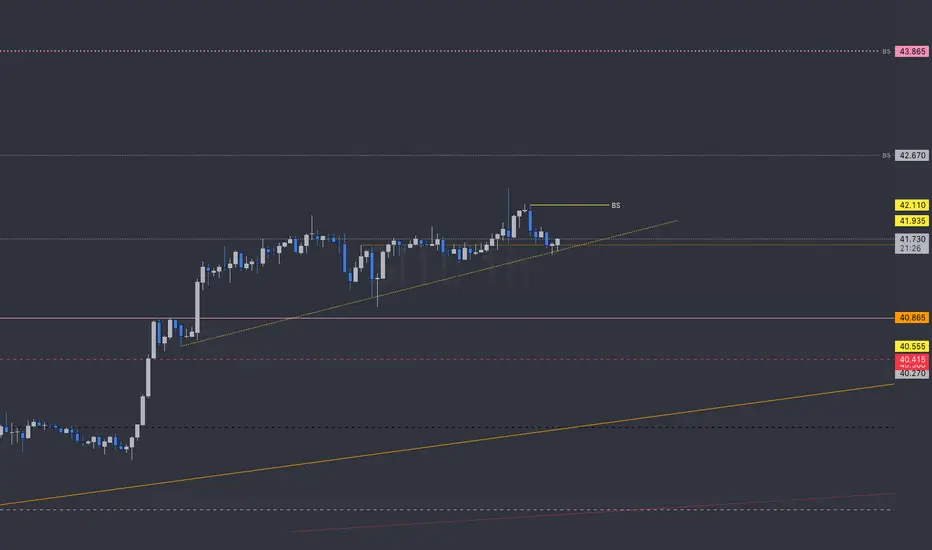
4 candles, 6 Levels, & MarketMeta:
1hr timeframe is holding the accumulation range trend and gaining the 4hr FS support. If price falls below the orange line it becomes the Inv.FS Resistance.
lots of support below price though to gain liquidity to continue higher but these levels of resistance above are over 4,000 days old. If time is an indicator of strength. Then, expect some old timers to move.
Quick sharp wicks up like the distribution candle on 03 Sept 08:00 should be expected when moving up through thick resistance then big impulses upward once confirmation is made for its support.
Weekly = Grey
Daily = Red
4hr = Orange
1hr = Yellow
15min = Blue
5min = Green
4 candles, 6 Levels, & MarketMeta:
1hr timeframe is holding the accumulation range trend and gaining the 4hr FS support. If price falls below the orange line it becomes the Inv.FS Resistance.
lots of support below price though to gain liquidity to continue higher but these levels of resistance above are over 4,000 days old. If time is an indicator of strength. Then, expect some old timers to move.
Quick sharp wicks up like the distribution candle on 03 Sept 08:00 should be expected when moving up through thick resistance then big impulses upward once confirmation is made for its support.
إخلاء المسؤولية
لا يُقصد بالمعلومات والمنشورات أن تكون، أو تشكل، أي نصيحة مالية أو استثمارية أو تجارية أو أنواع أخرى من النصائح أو التوصيات المقدمة أو المعتمدة من TradingView. اقرأ المزيد في شروط الاستخدام.
إخلاء المسؤولية
لا يُقصد بالمعلومات والمنشورات أن تكون، أو تشكل، أي نصيحة مالية أو استثمارية أو تجارية أو أنواع أخرى من النصائح أو التوصيات المقدمة أو المعتمدة من TradingView. اقرأ المزيد في شروط الاستخدام.