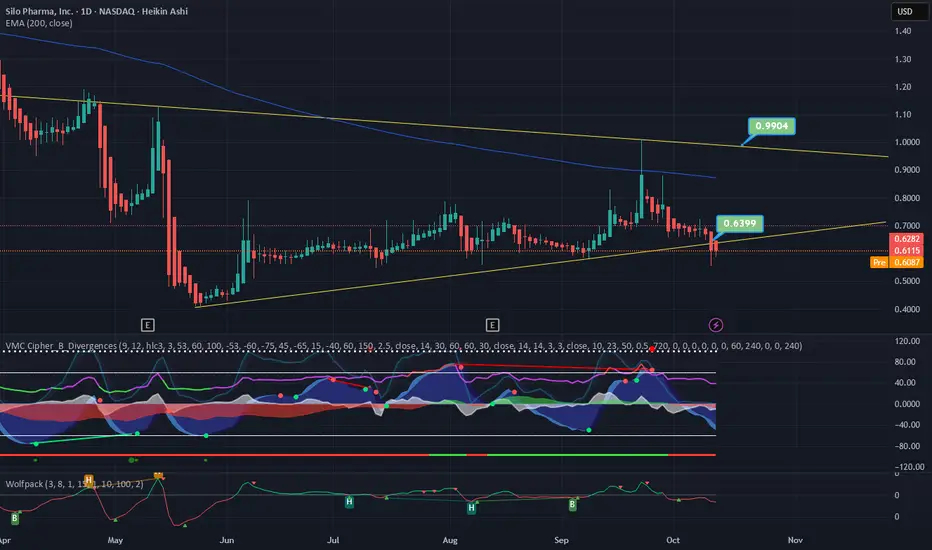
SILO is coiling inside a symmetrical triangle, building pressure for a potential breakout. The stock continues to respect its rising support trendline near $0.58–$0.60, showing solid accumulation.
The 200-day EMA (~$0.87) now acts as the key resistance to watch. A clean breakout and close above it could trigger momentum toward $0.99, the upper boundary of the triangle pattern.
Setup:
Entry: $0.60–$0.64
Targets: $0.87 / $0.99
Stop Loss: Below $0.57
Momentum indicators show early signs of strength. Holding the ascending trendline keeps the bullish bias intact — breakout confirmation above $0.87 could open the next leg up.
إخلاء المسؤولية
لا يُقصد بالمعلومات والمنشورات أن تكون، أو تشكل، أي نصيحة مالية أو استثمارية أو تجارية أو أنواع أخرى من النصائح أو التوصيات المقدمة أو المعتمدة من TradingView. اقرأ المزيد في شروط الاستخدام.
إخلاء المسؤولية
لا يُقصد بالمعلومات والمنشورات أن تكون، أو تشكل، أي نصيحة مالية أو استثمارية أو تجارية أو أنواع أخرى من النصائح أو التوصيات المقدمة أو المعتمدة من TradingView. اقرأ المزيد في شروط الاستخدام.