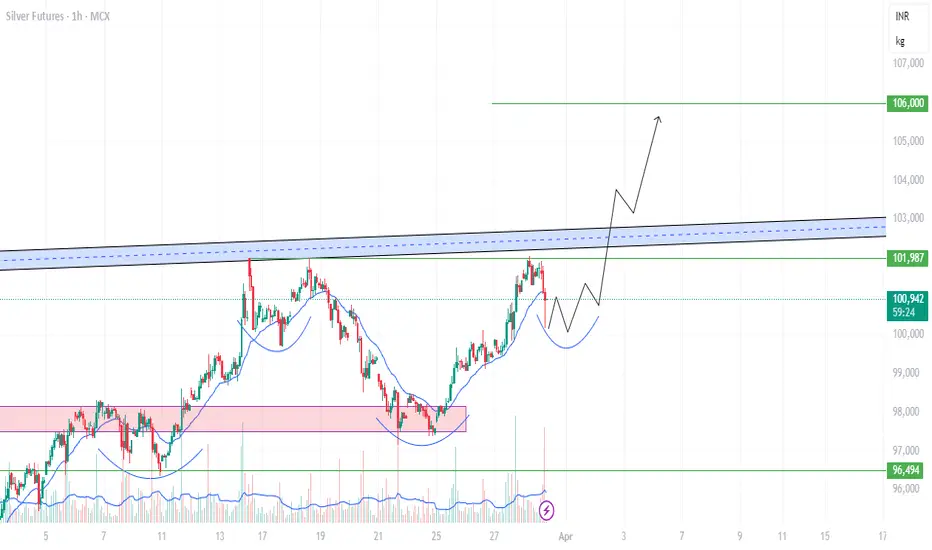
chart shows an Inverse Head and Shoulders pattern in Silver Futures on the 1-hour timeframe.
The neckline (resistance) is marked by the blue zone, which, if broken with strong volume, could confirm a bullish breakout. The projected price movement (black arrow) suggests a potential rally toward ₹106,000.
A confirmation would come if the price breaks above the ₹101,987 - ₹103,000 resistance zone with volume.
Place SL below the right shoulder (~₹100,000) for a safe trade.
إخلاء المسؤولية
لا يُقصد بالمعلومات والمنشورات أن تكون، أو تشكل، أي نصيحة مالية أو استثمارية أو تجارية أو أنواع أخرى من النصائح أو التوصيات المقدمة أو المعتمدة من TradingView. اقرأ المزيد في شروط الاستخدام.
إخلاء المسؤولية
لا يُقصد بالمعلومات والمنشورات أن تكون، أو تشكل، أي نصيحة مالية أو استثمارية أو تجارية أو أنواع أخرى من النصائح أو التوصيات المقدمة أو المعتمدة من TradingView. اقرأ المزيد في شروط الاستخدام.