I’m extremely bullish on SoFi long-term, but the chart is signaling a potential pullback opportunity before the next leg up.
🔹 Technical Breakdown:
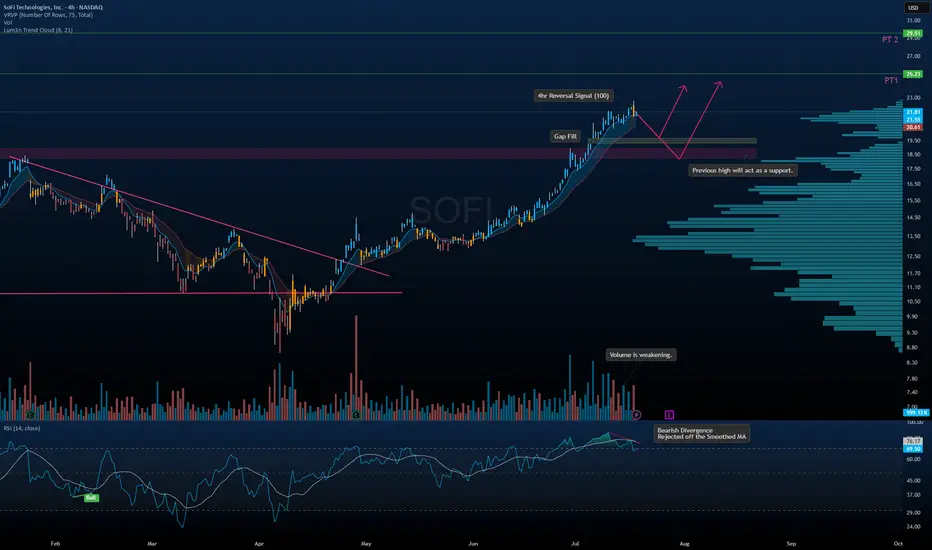
• Bearish Divergence on RSI with rejection off the smoothed MA
• Volume weakening as price moves higher – classic sign of exhaustion
• 4hr Reversal Signal flashing near local highs
• Gap Fill zone near $19.50 + previous highs = strong support zone
• Lum3n Trend Cloud still bullish — trend intact unless breakdown occurs
🎯 Targets:
• PT1 → $23.25
• PT2 → $29.50 (longer-term structure extension)
🧠 Thesis:
Letting price come to us is the smarter move here. I’m watching the $19.50–$20.00 zone closely for potential accumulation. That level has strong confluence with volume shelf, support, and fib structure.
🔹 Technical Breakdown:
• Bearish Divergence on RSI with rejection off the smoothed MA
• Volume weakening as price moves higher – classic sign of exhaustion
• 4hr Reversal Signal flashing near local highs
• Gap Fill zone near $19.50 + previous highs = strong support zone
• Lum3n Trend Cloud still bullish — trend intact unless breakdown occurs
🎯 Targets:
• PT1 → $23.25
• PT2 → $29.50 (longer-term structure extension)
🧠 Thesis:
Letting price come to us is the smarter move here. I’m watching the $19.50–$20.00 zone closely for potential accumulation. That level has strong confluence with volume shelf, support, and fib structure.
إخلاء المسؤولية
لا يُقصد بالمعلومات والمنشورات أن تكون، أو تشكل، أي نصيحة مالية أو استثمارية أو تجارية أو أنواع أخرى من النصائح أو التوصيات المقدمة أو المعتمدة من TradingView. اقرأ المزيد في شروط الاستخدام.
إخلاء المسؤولية
لا يُقصد بالمعلومات والمنشورات أن تكون، أو تشكل، أي نصيحة مالية أو استثمارية أو تجارية أو أنواع أخرى من النصائح أو التوصيات المقدمة أو المعتمدة من TradingView. اقرأ المزيد في شروط الاستخدام.