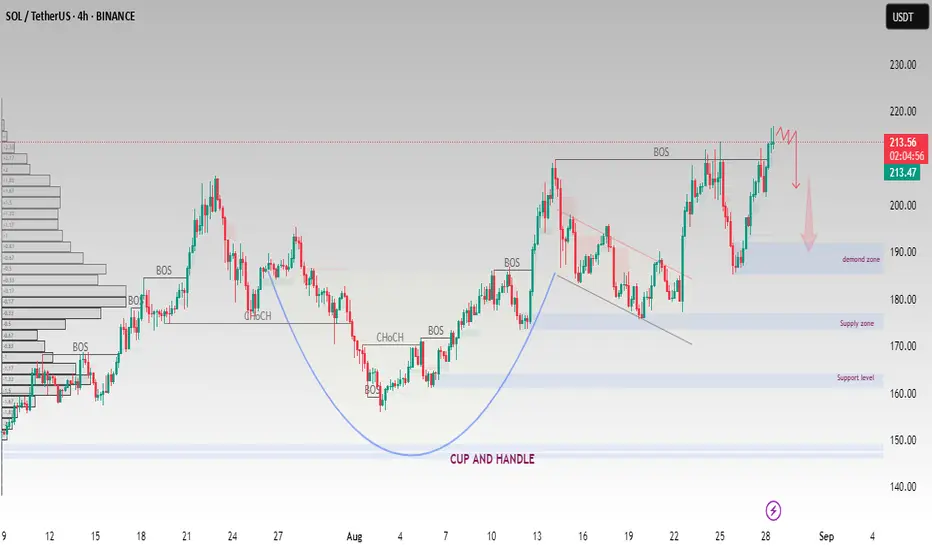
Solana (SOL/USDT) on the 4H chart is showing a Cup & Handle pattern, a bullish continuation formation. Price has recently broken the neckline around 213 – 215, but it is now facing strong resistance near the 220 zone.
Key levels to watch:
Resistance: 215 – 220 (possible rejection area)
Demand zone: 190 – 200 (potential pullback level)
Supply zone: 170 – 180 (secondary support if deeper correction occurs)
Support level: 160 (major downside protection)
If price sustains above 220, continuation toward 230+ may be expected.
A rejection at resistance could trigger a retest of the 190 – 200 demand zone before any bullish continuation.
Bullish in the bigger structure, but short-term correction remains possible.
This analysis is for educational purposes only and should not be considered financial advice. Always manage your risk and trade according to your plan.
تم فتح الصفقة
Trade has been active ; Risk mange has properlyأغلقت الصفقة: تم الوصول للهدف
TRADE HAS BEEN SUCCESSFULLY$ FOREX / GOLD / BTC | Real Trades,Real Result | Risk-managed strategiesn &VIP Signal {My Personal Entries} Join Telegram _ Trade smater ||
📬 Join Free Channel:
t.me/profitmagnetpro12
📬 Join Free Channel:
t.me/profitmagnetpro12
منشورات ذات صلة
إخلاء المسؤولية
لا يُقصد بالمعلومات والمنشورات أن تكون، أو تشكل، أي نصيحة مالية أو استثمارية أو تجارية أو أنواع أخرى من النصائح أو التوصيات المقدمة أو المعتمدة من TradingView. اقرأ المزيد في شروط الاستخدام.
$ FOREX / GOLD / BTC | Real Trades,Real Result | Risk-managed strategiesn &VIP Signal {My Personal Entries} Join Telegram _ Trade smater ||
📬 Join Free Channel:
t.me/profitmagnetpro12
📬 Join Free Channel:
t.me/profitmagnetpro12
منشورات ذات صلة
إخلاء المسؤولية
لا يُقصد بالمعلومات والمنشورات أن تكون، أو تشكل، أي نصيحة مالية أو استثمارية أو تجارية أو أنواع أخرى من النصائح أو التوصيات المقدمة أو المعتمدة من TradingView. اقرأ المزيد في شروط الاستخدام.