🔹SOL/USDT (4H) – Technical Analysis
▪ Key Price Zones
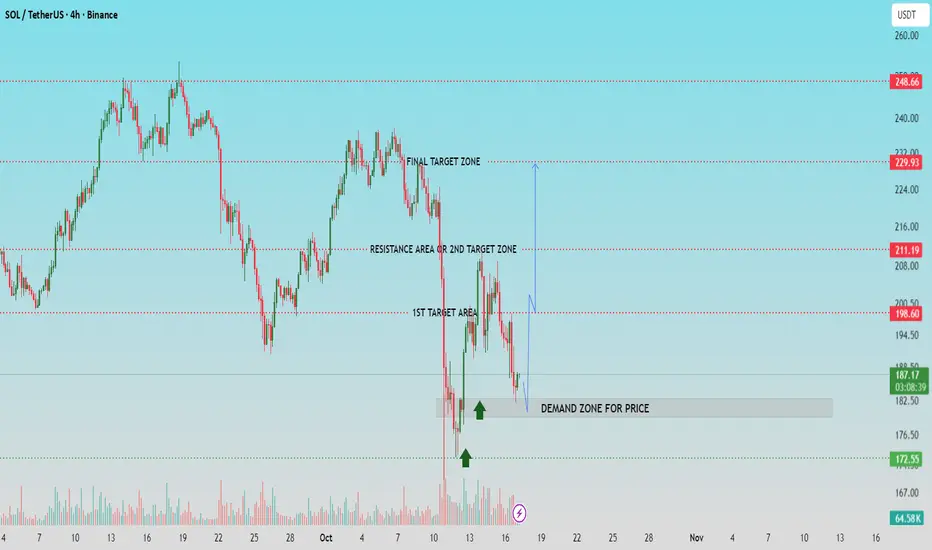
▫ Demand Zone: 182.5 – 176.5
SOL is currently trading inside a well-defined demand zone. Price has reacted positively to this level twice before (green arrows), suggesting buyer interest and possible accumulation.
▫1st Target Area: 198.60
This level has acted as a strong supply/resistance zone in the past and represents the first upside target if the price successfully bounces from the demand zone.
▫ 2nd Target Zone / Resistance Area: 211.19
A move beyond the first target could bring SOL into this resistance zone, which previously capped bullish momentum.
▫Final Target Zone: 229.93
This is the upper resistance area and final bullish target based on historical highs and market structure.
▪ Market Structure & Setup
Price recently dropped sharply into the demand zone but has begun to consolidate.
Volume spikes during the decline followed by stabilization indicate a potential short-term bottoming pattern.
The projected move (in blue) suggests a rebound from this demand zone with potential resistance at each target level.
▪Outlook:
▫ Bullish Scenario: If demand holds and price confirms a reversal (e.g., bullish engulfing, breakout candle), expect a move toward 198.60, followed by 211.19 and possibly 229.93.
▫ Bearish Scenario: A sustained break below 176.5 may invalidate the bullish thesis and open downside toward the next support (not shown, likely around 172.55 or lower).
▪Conclusion:
SOL/USDT is at a critical support level. A bullish reaction here could set the stage for a multi-leg recovery. However, confirmation is key before entering long positions.
Support Me For More Insightful Analysis.
▪ Key Price Zones
▫ Demand Zone: 182.5 – 176.5
SOL is currently trading inside a well-defined demand zone. Price has reacted positively to this level twice before (green arrows), suggesting buyer interest and possible accumulation.
▫1st Target Area: 198.60
This level has acted as a strong supply/resistance zone in the past and represents the first upside target if the price successfully bounces from the demand zone.
▫ 2nd Target Zone / Resistance Area: 211.19
A move beyond the first target could bring SOL into this resistance zone, which previously capped bullish momentum.
▫Final Target Zone: 229.93
This is the upper resistance area and final bullish target based on historical highs and market structure.
▪ Market Structure & Setup
Price recently dropped sharply into the demand zone but has begun to consolidate.
Volume spikes during the decline followed by stabilization indicate a potential short-term bottoming pattern.
The projected move (in blue) suggests a rebound from this demand zone with potential resistance at each target level.
▪Outlook:
▫ Bullish Scenario: If demand holds and price confirms a reversal (e.g., bullish engulfing, breakout candle), expect a move toward 198.60, followed by 211.19 and possibly 229.93.
▫ Bearish Scenario: A sustained break below 176.5 may invalidate the bullish thesis and open downside toward the next support (not shown, likely around 172.55 or lower).
▪Conclusion:
SOL/USDT is at a critical support level. A bullish reaction here could set the stage for a multi-leg recovery. However, confirmation is key before entering long positions.
Support Me For More Insightful Analysis.
تم فتح الصفقة
from last support areaملاحظة
160 pips+ secured ملاحظة
price can give once again respect to the same demand zoneأغلقت الصفقة: تم الوصول للهدف
💸FREE FOREX Signals in Telegram : t.me/FxInsightsHub0
🔹Join Our Telegram Channel, Pure Price Action Based Signals With Chart Analysis.
t.me/FxInsightsHub0
🚀FREE CRYPTO Signals In Telegram: t.me/FxInsightsHub0
🔹Join Our Telegram Channel, Pure Price Action Based Signals With Chart Analysis.
t.me/FxInsightsHub0
🚀FREE CRYPTO Signals In Telegram: t.me/FxInsightsHub0
منشورات ذات صلة
إخلاء المسؤولية
لا يُقصد بالمعلومات والمنشورات أن تكون، أو تشكل، أي نصيحة مالية أو استثمارية أو تجارية أو أنواع أخرى من النصائح أو التوصيات المقدمة أو المعتمدة من TradingView. اقرأ المزيد في شروط الاستخدام.