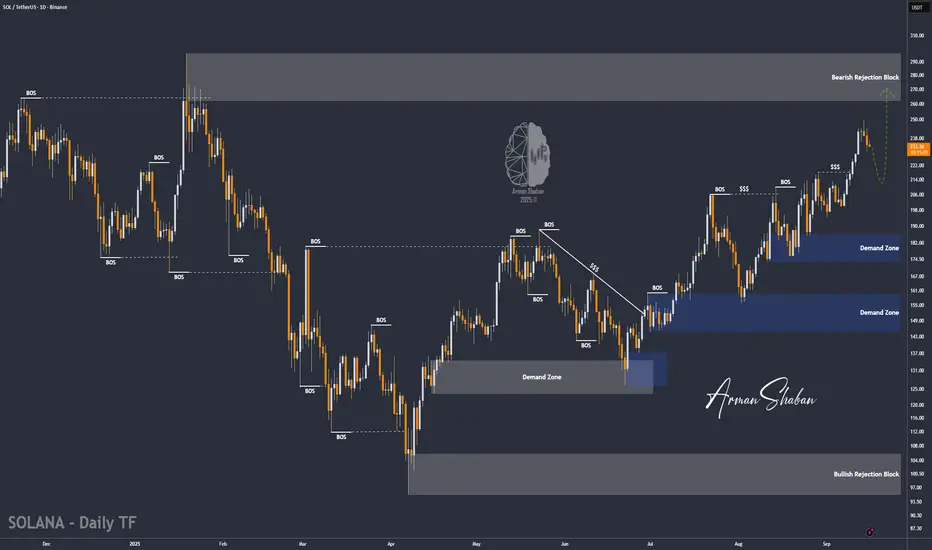
By analyzing the Solana chart on the daily timeframe, we can see that after a correction, the price is now trading around $234. In the short term, I expect a small pullback, followed by another strong bullish move from this coin.
The key demand zone is between $210–$220, while the possible upside targets are $250, $260, and $296.
Please support me with your likes and comments to motivate me to share more analysis with you and share your opinion about the possible trend of this chart with me !
Best Regards , Arman Shaban
The key demand zone is between $210–$220, while the possible upside targets are $250, $260, and $296.
Please support me with your likes and comments to motivate me to share more analysis with you and share your opinion about the possible trend of this chart with me !
Best Regards , Arman Shaban
تم فتح الصفقة
By analyzing the Solana chart on the daily timeframe, we can see that the price is trading around $234. I expect a short correction here, followed by the start of the next bullish wave.The key demand zone is between $210–$220. If the price holds above $230, it could trigger the next bullish move, but for the uptrend to continue, a strong breakout above $250 is needed. The possible upside targets are $250, $260, and $296.
أغلقت الصفقة: تم الوصول للهدف
Since the last analysis, Solana (SOL) has climbed to $248, gaining more than 7% in just one day. The bullish momentum remains very strong, showing buyers are still in control.As long as SOL holds above the $230 support zone, the trend points higher. The next key upside targets remain at $250, $260, and $296.
⚜️ Free TG Channel : t.me/PriceAction_ICT
⚜️ Contact for VIP : t.me/ArmanShabanTrading
🎉 The Best Crypto Exchange ($100 Bonus) : lbank.com/ref/4Y77P
✅ One of the Best Forex Brokers (Lirunex) : bit.ly/4oCawfH
⚜️ Contact for VIP : t.me/ArmanShabanTrading
🎉 The Best Crypto Exchange ($100 Bonus) : lbank.com/ref/4Y77P
✅ One of the Best Forex Brokers (Lirunex) : bit.ly/4oCawfH
منشورات ذات صلة
إخلاء المسؤولية
لا يُقصد بالمعلومات والمنشورات أن تكون، أو تشكل، أي نصيحة مالية أو استثمارية أو تجارية أو أنواع أخرى من النصائح أو التوصيات المقدمة أو المعتمدة من TradingView. اقرأ المزيد في شروط الاستخدام.