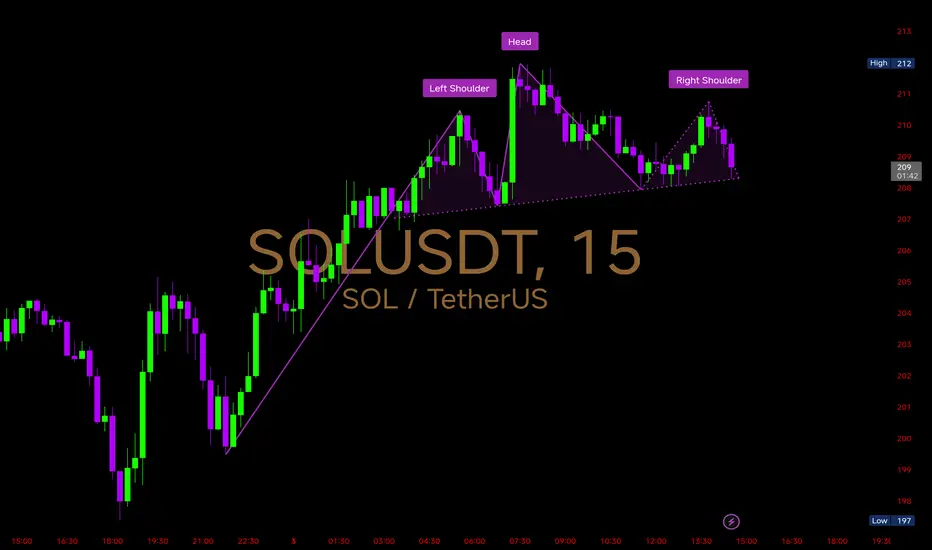
A Head & Shoulders pattern has formed with the left shoulder near 210, head at 212, and right shoulder around 211.
Key Technical Levels
Neckline Support: Around 208 – if this breaks decisively, we could see stronger bearish momentum.
Immediate Resistance: 210–212 (right shoulder + recent high). A breakout above invalidates the bearish pattern.
Downside Targets: If the neckline fails, price could test 205 → 202 → 197 support zones.
Bullish Case: Sustaining above 212 would flip the structure invalid, pushing price back into 215–220 zone.
Right now, #SOLANA is at a critical point – holding above the neckline keeps bulls alive, but losing it confirms a bearish breakdown.
إخلاء المسؤولية
لا يُقصد بالمعلومات والمنشورات أن تكون، أو تشكل، أي نصيحة مالية أو استثمارية أو تجارية أو أنواع أخرى من النصائح أو التوصيات المقدمة أو المعتمدة من TradingView. اقرأ المزيد في شروط الاستخدام.
إخلاء المسؤولية
لا يُقصد بالمعلومات والمنشورات أن تكون، أو تشكل، أي نصيحة مالية أو استثمارية أو تجارية أو أنواع أخرى من النصائح أو التوصيات المقدمة أو المعتمدة من TradingView. اقرأ المزيد في شروط الاستخدام.