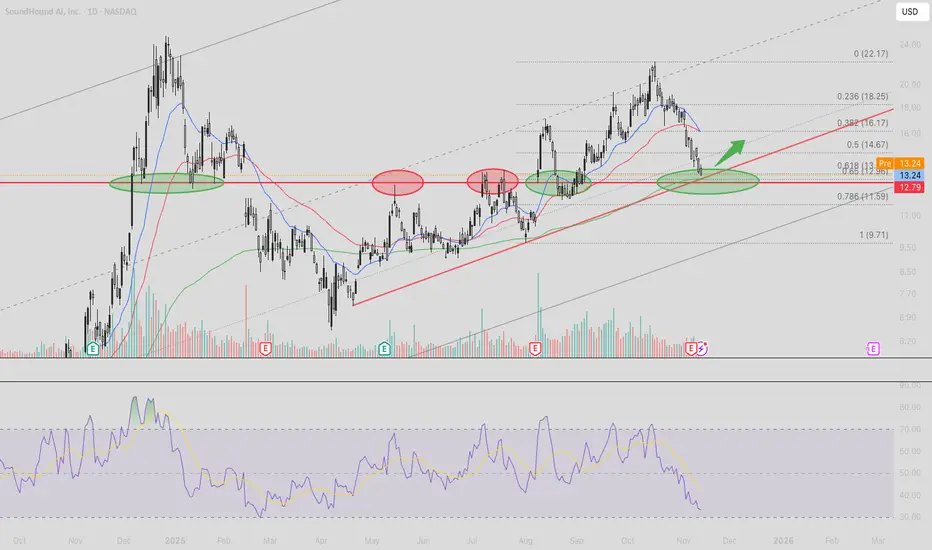
Analysis based on the daily timeframe. Price retraced sharply from recent highs and is now testing a major confluence area combining Fibonacci, trendline support, and prior structure. This zone has historically attracted buyers and often marks a higher-low formation in an active uptrend.
Structure
Key Levels
Fibonacci or Wave Targets
Outlook / Scenarios
Holding above the $12.8–$13.3 cluster keeps the daily bullish structure intact.
Structure
- Price pulled back into the 0.618 retracement of the full summer rally
- Retest of the rising trendline within the broader ascending channel
- Demand zone aligns with prior support/resistance flips
- RSI approaching oversold levels, consistent with pullback exhaustion
- Bias: cautiously bullish while holding above the current support cluster
Key Levels
- Support: $12.80–$13.30 (primary demand zone)
- Resistance: $14.70, $16.17, $18.25
- Invalidation: daily close below $12.50
Fibonacci or Wave Targets
- 0.618 retrace → $13.00 area (current reaction zone)
- 0.50 retrace → $14.67
- 0.382 retrace → $16.17
- 0.236 retrace → $18.25
Outlook / Scenarios
- Primary scenario – Price forms a higher low above $12.8–$13.3 and rebounds toward $14.7 and $16.1 as momentum recovers.
- Alternate scenario – Breakdown below $12.50 opens room toward $11.59 (0.786 fib) and potentially $9.70 if the trendline fails.
Holding above the $12.8–$13.3 cluster keeps the daily bullish structure intact.
إخلاء المسؤولية
لا يُقصد بالمعلومات والمنشورات أن تكون، أو تشكل، أي نصيحة مالية أو استثمارية أو تجارية أو أنواع أخرى من النصائح أو التوصيات المقدمة أو المعتمدة من TradingView. اقرأ المزيد في شروط الاستخدام.
إخلاء المسؤولية
لا يُقصد بالمعلومات والمنشورات أن تكون، أو تشكل، أي نصيحة مالية أو استثمارية أو تجارية أو أنواع أخرى من النصائح أو التوصيات المقدمة أو المعتمدة من TradingView. اقرأ المزيد في شروط الاستخدام.