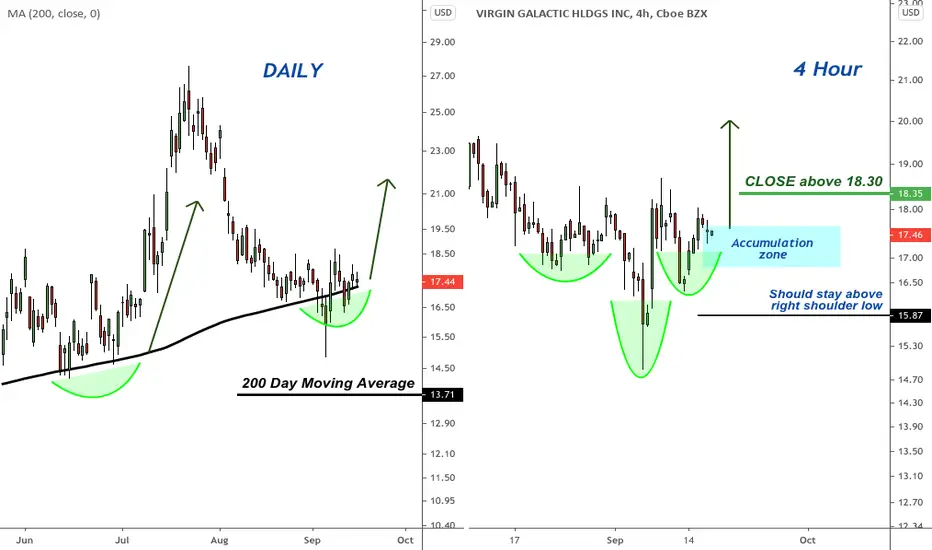
On the left chart we're looking at the Daily time frame. Notice price is currently resting at the 200 day moving average after reclaiming it earlier this month.
That's positive.
On the right chart we're looking at the 240 min/4hr time frame where price currently displays a possible H&S construction. The stock is at a good accumulation zone here as long as the recent lows hold.
A CLOSE above 18.30 on the 4hr or daily chart can give conservative traders confirmation to get long. Aggressive traders could start buying inside the accumulation zone with stops under the black line I drew (a CLOSE under it would be needed to invalidate the position).
أغلقت الصفقة: تم الوصول لوقف الخسارة
Manually stopped todayملاحظة
Massive bottom confirmed after today's price action. My buy stops were triggered at 18.30. If I didn't have buy stops resting I would have missed this trade as my aggressive entries at 17 were all stopped out.ملاحظة
2 week time-frame is breaking out of the triangle. SPCE could be trading in the 30s soon:إخلاء المسؤولية
لا يُقصد بالمعلومات والمنشورات أن تكون، أو تشكل، أي نصيحة مالية أو استثمارية أو تجارية أو أنواع أخرى من النصائح أو التوصيات المقدمة أو المعتمدة من TradingView. اقرأ المزيد في شروط الاستخدام.
إخلاء المسؤولية
لا يُقصد بالمعلومات والمنشورات أن تكون، أو تشكل، أي نصيحة مالية أو استثمارية أو تجارية أو أنواع أخرى من النصائح أو التوصيات المقدمة أو المعتمدة من TradingView. اقرأ المزيد في شروط الاستخدام.