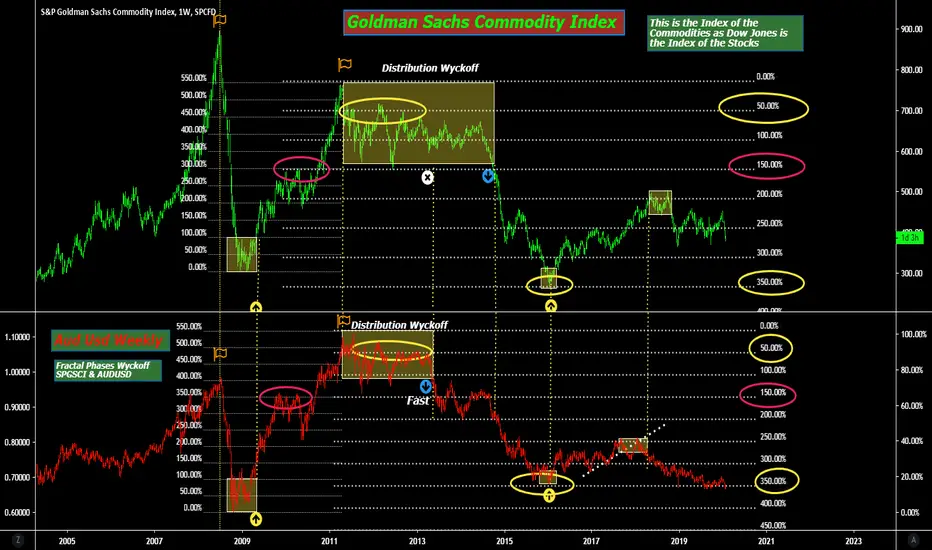
350 % - 550% very important for the grid for trend short is the 0 ( extreme high) - 150 ( last relative top before extreme high ) 50 ( pull back later estreme high ) , the 350 descending is 1° first very obstacle for trend short ( or trend long , a great trend is 2 movement 0-350 and 350- 550 ( can you see that in dow jones 1900 -2020 , bottom is 1932 , 1965 -1966 is 350% now we are in 550% !!!!! ) , if it exceeds 350% ( 7 times the base of Gann ) the bottom ( or the top ) is under 350% , the bottom , the end of trend short of the great distribution, is zone 550% .
إخلاء المسؤولية
لا يُقصد بالمعلومات والمنشورات أن تكون، أو تشكل، أي نصيحة مالية أو استثمارية أو تجارية أو أنواع أخرى من النصائح أو التوصيات المقدمة أو المعتمدة من TradingView. اقرأ المزيد في شروط الاستخدام.
إخلاء المسؤولية
لا يُقصد بالمعلومات والمنشورات أن تكون، أو تشكل، أي نصيحة مالية أو استثمارية أو تجارية أو أنواع أخرى من النصائح أو التوصيات المقدمة أو المعتمدة من TradingView. اقرأ المزيد في شروط الاستخدام.