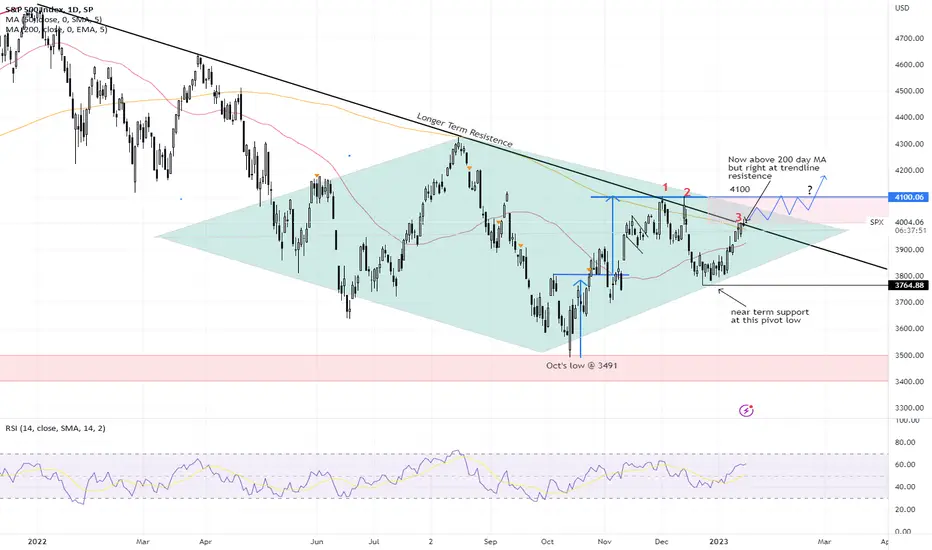
On Jan 3, I posted that SPX had been trading in a diamond pattern since late May, a potentially bottoming formation in a bearish market. It has been 2 weeks since and this pattern continues to play out.
2 days ago, SPX managed to close above its 200 day moving average and stopped right at the critical longer term trendline resistence again. This is the 3rd attempt testing the 200 day MA as well as the trendline resistence in the past 1.5 months.
The odds have increased that it will eventually test the 4100 level in the not too distant future, We may face some resistence at 4100 but the next pullback could be an opportunity to buy the dips, especially if pull backs do not bring it below the 200 day moving average again or formed a higher low.
Signs that a new bull could have returned (in the following order):
1. trading above both longer term trendline resistence (black) AND 200 day moving average
2. Golden cross, ie 50day MA crossing above 200day MA. May happen within the next couple of weeks? However, the market could continue to gyrate wildly for weeks more until the 200 day MA can flatten out
3. finally, trading above the 4100 level and by then the 200 day MA could be starting to slope upwards
Let's see.
Disclaimer: Just my 2 cents and not a trade advice. I may or may not enter into this trade. Kindly do your own due diligence and trade according to your own risk tolerance and don't forget that money management is important! Take care and Good Luck!
إخلاء المسؤولية
لا يُقصد بالمعلومات والمنشورات أن تكون، أو تشكل، أي نصيحة مالية أو استثمارية أو تجارية أو أنواع أخرى من النصائح أو التوصيات المقدمة أو المعتمدة من TradingView. اقرأ المزيد في شروط الاستخدام.
إخلاء المسؤولية
لا يُقصد بالمعلومات والمنشورات أن تكون، أو تشكل، أي نصيحة مالية أو استثمارية أو تجارية أو أنواع أخرى من النصائح أو التوصيات المقدمة أو المعتمدة من TradingView. اقرأ المزيد في شروط الاستخدام.