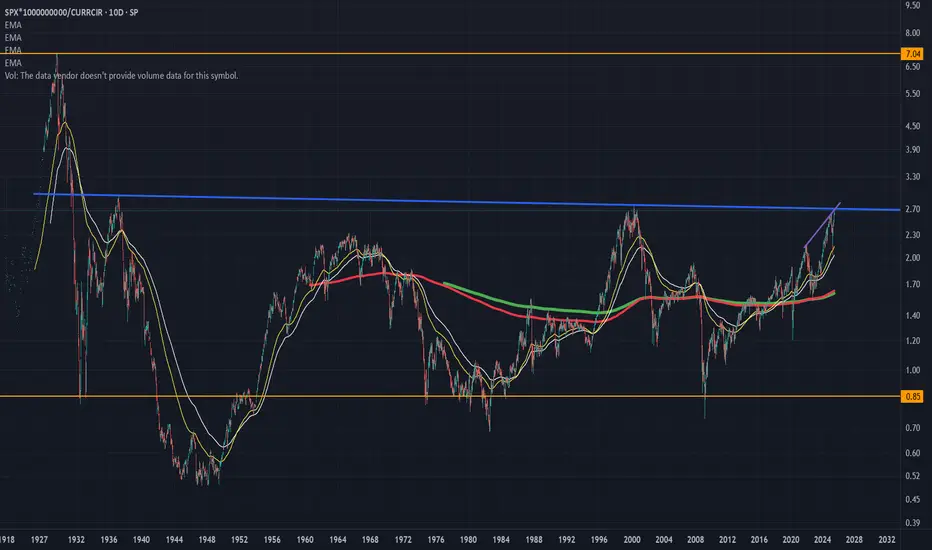
Here is a chart of the entire S and P history versus total currency in circulation.
This gives bubble periods (anytime the value is over 2) and times when the market crashed after being in a bubble.
If you notice we are fast approaching the line that broke the neck of the market in the 60s and 2000 dotcom bust.
If we clear that line, hold on to your hats because we are going into full blown speculative mania like just before the Great Depression!
In fact maybe the AI-crypto bubble will be exactly like the Great Depression, AI causing mass unemployment and global poverty.
تم فتح الصفقة
I meant the 2 times that line snapped the neck of the bull was in 1936 and 2000 (not the 60s crash which was only a minor bubble).إخلاء المسؤولية
لا يُقصد بالمعلومات والمنشورات أن تكون، أو تشكل، أي نصيحة مالية أو استثمارية أو تجارية أو أنواع أخرى من النصائح أو التوصيات المقدمة أو المعتمدة من TradingView. اقرأ المزيد في شروط الاستخدام.
إخلاء المسؤولية
لا يُقصد بالمعلومات والمنشورات أن تكون، أو تشكل، أي نصيحة مالية أو استثمارية أو تجارية أو أنواع أخرى من النصائح أو التوصيات المقدمة أو المعتمدة من TradingView. اقرأ المزيد في شروط الاستخدام.