Technical Analysis and Outlook:
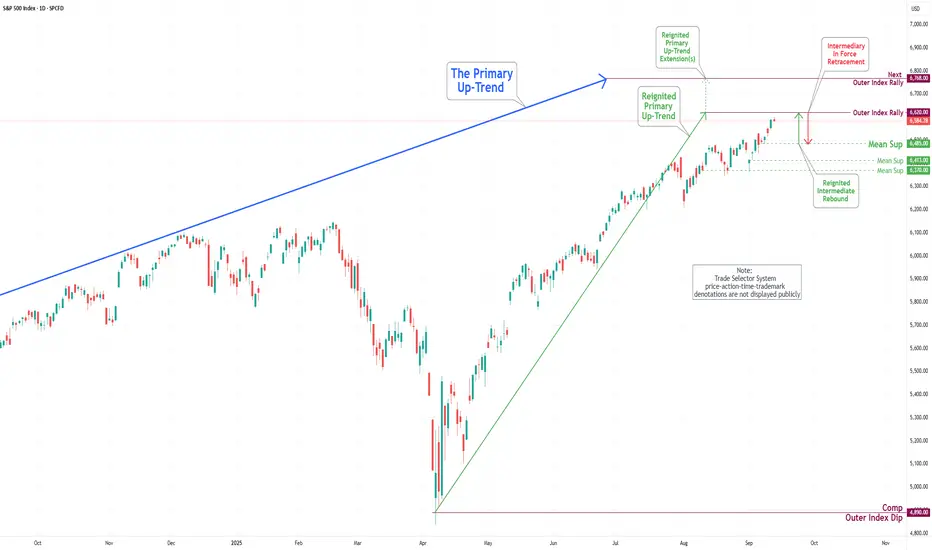
In the previous trading session, the S&P 500 Index exhibited a substantial upward movement, reaching and completing the Outer Index Rally 6543, and it is striding towards our current designated target: Outer Index Rally 6620, as detailed in the prior S&P 500 Daily Chart Analysis.
It is critical to recognize that upon reaching this momentous target, the resulting price action is anticipated to initiate a significant pullback targeting the Mean Support level of 6485. This pullback is likely to facilitate a considerable rebound, allowing for a subsequent retest of the Outer Index Rally level of 6620.
منشورات ذات صلة
إخلاء المسؤولية
The information and publications are not meant to be, and do not constitute, financial, investment, trading, or other types of advice or recommendations supplied or endorsed by TradingView. Read more in the Terms of Use.
إخلاء المسؤولية
The information and publications are not meant to be, and do not constitute, financial, investment, trading, or other types of advice or recommendations supplied or endorsed by TradingView. Read more in the Terms of Use.