Current Structure & Price action -
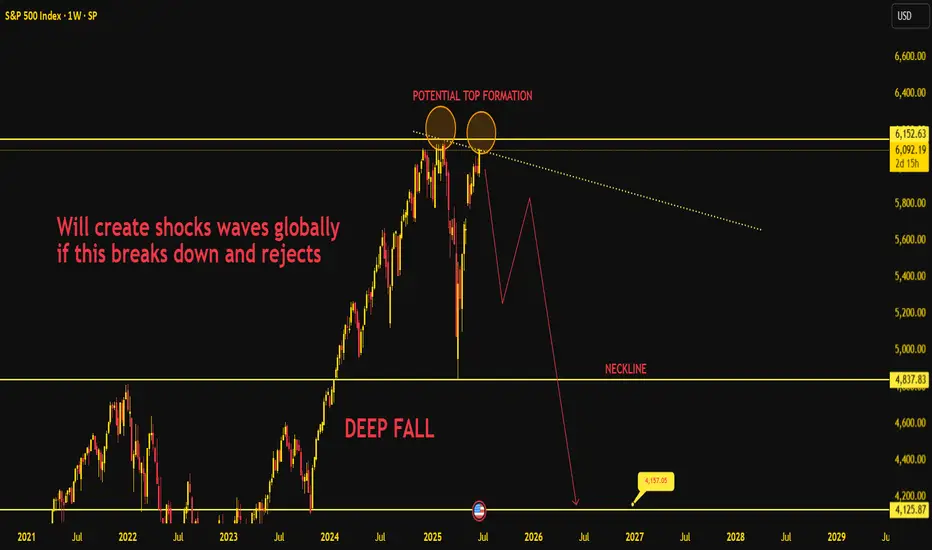
The S&P 500 is showing early signs of forming a macro double top, one of the most powerful reversal patterns in Price action when occurring at all-time highs. The zone around 6150–6170 has now been tested twice once in March 2025 and again in June 2025. Each time, the price faced rejection, hinting at buyer exhaustion at the peak.
What makes this chart technically threatening is the alignment of:
A potential double top with weak volume on the second peak.
A visible neckline at 4837, which represents the last zone of strong institutional demand and breakout origin from the October 2023 rally.
Clear visual symmetry between left and right shoulders indicating distribution rather than accumulation.
If price decisively breaks below 4837, we enter a freefall zone, targeting the 4150–4125 range — the next significant structural shelf.
Why This Setup Matters Globally
This is not just a Price action formation; it is a systemic risk signal:
If the S&P 500 cracks, it’ll act as a domino in:
Global equity indices (FTSE, DAX, NIKKEI, NIFTY).
Emerging market outflows (especially BRICS economies).
Commodity repricing (especially metals and crude, due to deflation fear).
Dollar Strength Scenario:
If this fall happens alongside USD strength (which often occurs during flight to safety), it may also lead to:
Emerging market currency devaluation.
Debt servicing problems for dollar-denominated borrowers.
Gold volatility (initial dip, then sharp rise as panic flows in).
Intermarket Readings & Divergences
US10Y Bond Yields: If yields continue to rise while the index weakens, it’s a death cross for growth sectors.
VIX: Still below 20, but any weekly close above 25 during this formation breakdown will trigger full-blown fear cycles.
Tech Stocks: Heavily weighted in the index. If large caps like AAPL, MSFT, NVDA start to fade, this fall will accelerate.
Roadmap Projection
Here’s the expected flow based on current structure:
Fakeout Above 6150 → quick rejection → triggers wave 1 fall.
Bounce from 5500–5600 (psychological + moving average confluence).
Neckline Retest (4837) – critical. If rejected again, freefall starts.
Major demand expected only around 4150–4125, where long-term investors might re-enter.
If neckline breaks with high volume and weekly close below, we could be looking at a 25–30% retracement from the highs.
Macro Echo of Past Crashes?
This pattern closely resembles:
2007–08 double top structure before Lehman.
Dotcom bust in 2000 where euphoria blinded exit signals.
The difference now? AI and tech hype has pushed valuations to unsustainable highs, and central banks are tight, not loose.
🔸 Final Take
This is not a normal pullback. The S&P is on the verge of confirming a generational top, with implications for every asset class. Once 4837 breaks, expect:
Mass volatility in global markets
Flight to cash and gold
Repricing of risk premiums
Action Plan:
If holding longs – reduce exposure, raise stop-losses.
Hedge via VIX calls or inverse ETFs.
Watch for a weekly rejection candle at 6150 to trigger confirmation.
This chart is a time bomb. The wick is lit.
Stay ahead of the market—Follow my channel for free insights~~ Telegram channel link below !
t.me/+jvSU52DTZAphYTc1
youtube.com/@TeamSpark-08
t.me/+jvSU52DTZAphYTc1
youtube.com/@TeamSpark-08
إخلاء المسؤولية
لا يُقصد بالمعلومات والمنشورات أن تكون، أو تشكل، أي نصيحة مالية أو استثمارية أو تجارية أو أنواع أخرى من النصائح أو التوصيات المقدمة أو المعتمدة من TradingView. اقرأ المزيد في شروط الاستخدام.