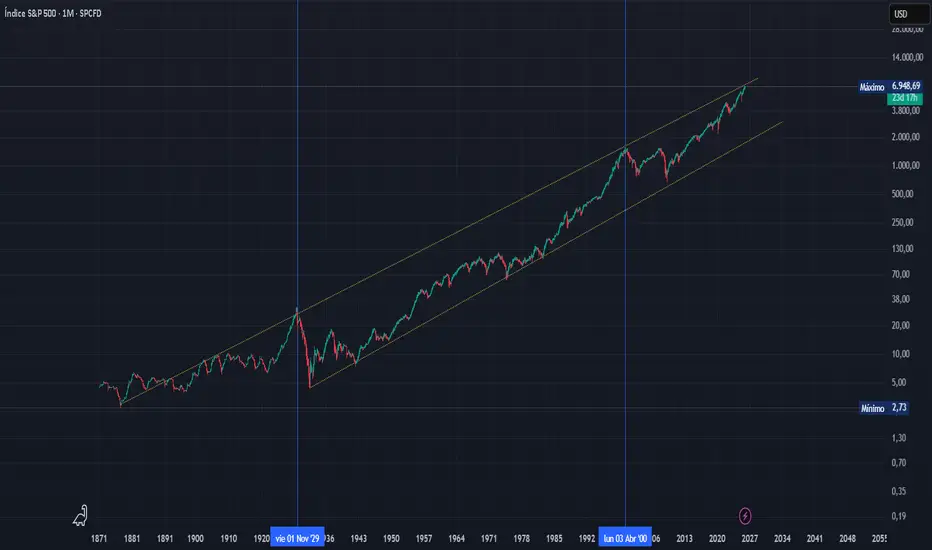
S&P 500 Monthly – Historical Logarithmic Chart –
The S&P 500 is approaching long-term resistance seen in 1929 and 2000.
In log scale, this represents limits to sustained percentage growth, highlighting elevated valuations and potential caution.
Historically, similar levels have led to deep corrections, sideways consolidation, or rare breakouts.
Key takeaway : At this stage, disciplined caution and selective positioning tend to generate better long-term alpha than chasing broad market gains.
إخلاء المسؤولية
لا يُقصد بالمعلومات والمنشورات أن تكون، أو تشكل، أي نصيحة مالية أو استثمارية أو تجارية أو أنواع أخرى من النصائح أو التوصيات المقدمة أو المعتمدة من TradingView. اقرأ المزيد في شروط الاستخدام.
إخلاء المسؤولية
لا يُقصد بالمعلومات والمنشورات أن تكون، أو تشكل، أي نصيحة مالية أو استثمارية أو تجارية أو أنواع أخرى من النصائح أو التوصيات المقدمة أو المعتمدة من TradingView. اقرأ المزيد في شروط الاستخدام.