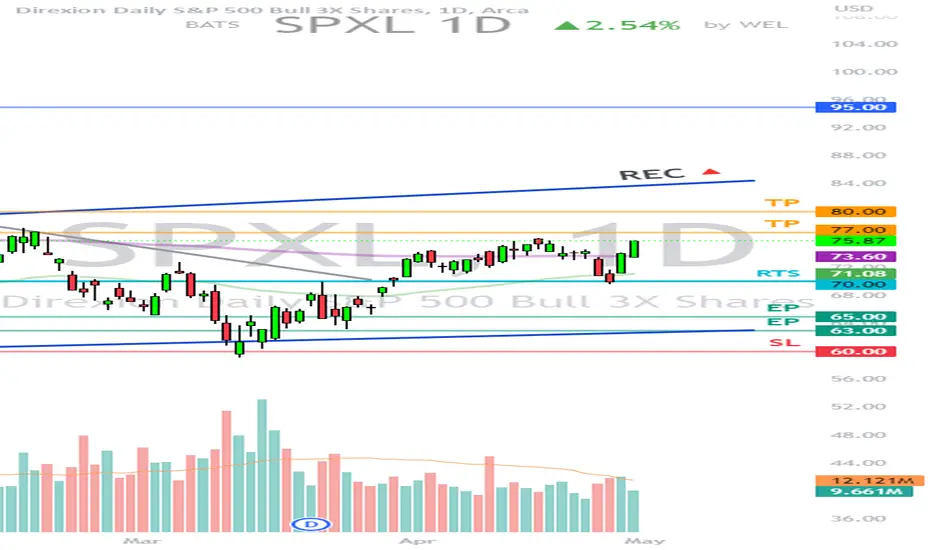
- SPXL has broken the ceiling of the falling trend in the medium long term, which indicates a slower initial falling rate.
- SPXL is moving within a rectangle formation between support at 62.45 and resistance at 83.75.
- A decisive break through one of these levels indicates the new direction for the stock.
- The stock has marginally broken up through resistance at 75.00.
- Overall assessed as technically neutral for the medium long term.
*EP: Enter Price, SL: Support, TP: Take Profit, CL: Cut Loss, TF: Time Frame, RST: Resistance, RTS: Resistance to be Support LT TP: Long Term Target Price
*Chart Pattern:
DT - Double Top | BEARISH | RED
DB - Double Bottom | BULLISH | GREEN
HNS - Head & Shoulder | BEARISH | RED
REC - Rectangle | BLUE
iHNS - inverse head & Shoulder | BULLISH | GREEN
Verify it first and believe later.
The most profitable U.S. Stock VIP Signals Provider in Telegram Channel | Check our latest product updates: bit.ly/wavepoint-vip |
For more info:
Telegram: t.me/Wel_99
X: x.com/wavepoint99
For more info:
Telegram: t.me/Wel_99
X: x.com/wavepoint99
إخلاء المسؤولية
لا يُقصد بالمعلومات والمنشورات أن تكون، أو تشكل، أي نصيحة مالية أو استثمارية أو تجارية أو أنواع أخرى من النصائح أو التوصيات المقدمة أو المعتمدة من TradingView. اقرأ المزيد في شروط الاستخدام.