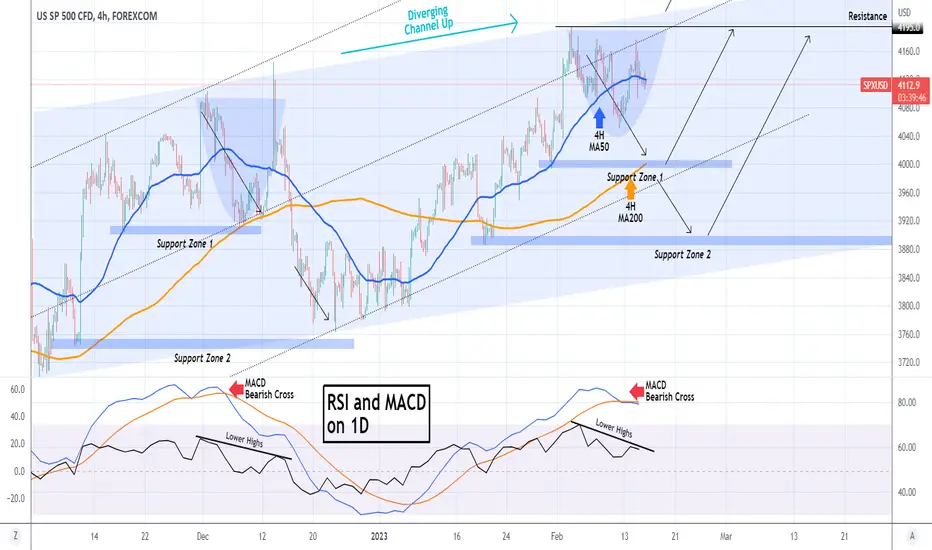
It appears that the Diverging Channel Up we spoke of last week eventually prevailed and the S&P500 index (SPX) is printing a Higher High formation similar to December 01 - 13. The pattern that carries this top formation is a Cup, which is now trading around the 4H MA50 (blue trend-line).
Based on the December fractal, the first target is the 4H MA200 (orange trend-line). A break below Support Zone 1 will extend our selling towards Support Zone 2, where near the bottom of the Channel Up we will place our long-term buys.
See how the 1D MACD Bearish Cross as well as the Lower Highs formation on the 1D RSI, also match those of the December peak.
-------------------------------------------------------------------------------
** Please LIKE 👍, FOLLOW ✅, SHARE 🙌 and COMMENT ✍ if you enjoy this idea! Also share your ideas and charts in the comments section below! **
-------------------------------------------------------------------------------
💸💸💸💸💸💸
👇 👇 👇 👇 👇 👇
👑Best Signals (Forex/Crypto+70% accuracy) & Account Management (+20% profit/month on 10k accounts)
💰Free Channel t.me/tradingshotglobal
🤵Contact info@tradingshot.com t.me/tradingshot
🔥New service: next X100 crypto GEMS!
💰Free Channel t.me/tradingshotglobal
🤵Contact info@tradingshot.com t.me/tradingshot
🔥New service: next X100 crypto GEMS!
إخلاء المسؤولية
لا يُقصد بالمعلومات والمنشورات أن تكون، أو تشكل، أي نصيحة مالية أو استثمارية أو تجارية أو أنواع أخرى من النصائح أو التوصيات المقدمة أو المعتمدة من TradingView. اقرأ المزيد في شروط الاستخدام.