SPY at a Critical Inflection — Liquidity Games This Week (Nov. 3–7) ⚠️📈
Weekly Structure (Macro Bias)
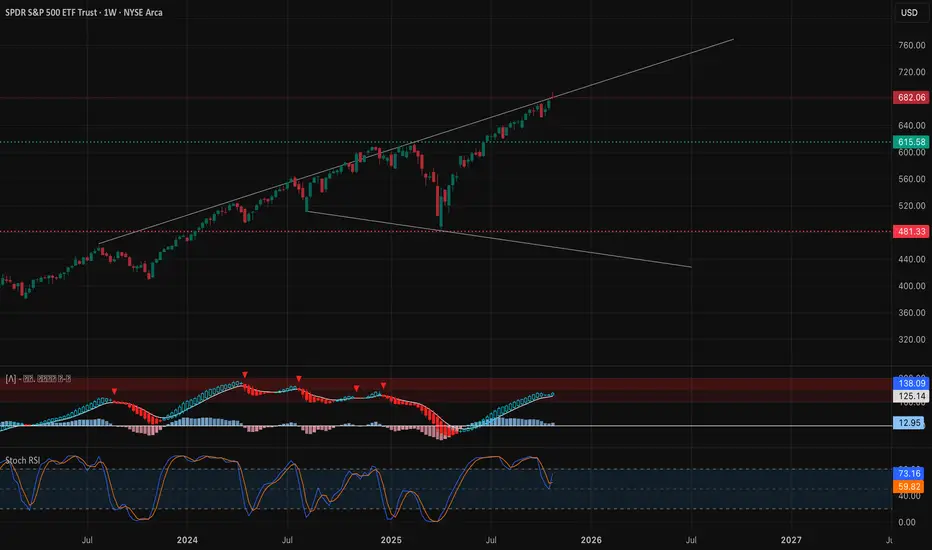
Market Structure: SPY has been grinding at the upper boundary of its rising macro channel, continuing a long series of BOS pushes. The most recent CHoCH was instantly reclaimed — that’s a bullish tell and suggests smart money defended aggressively. We’re now sitting right under fresh liquidity resting above last week’s highs.
Liquidity: Current price action shows clean liquidity grabs above prior pivot highs, followed by stabilization instead of sharp rejection. That’s constructive — but we’re reaching a zone where profit-taking historically appears.
Trend Direction: Still bullish on the weekly. Higher highs and higher lows are intact, but we’re extended into premium.
Weekly Supply & Demand:
* Demand: 613 → 600 (macro buy zone if we get any corrective rotation)
* Deeper Demand: 535 (big institutional buy pocket)
* Supply: 682–690 channel ceiling; don’t underestimate this
Smart money tends to rebalance right here before extending.
Indicators:
* 9EMA > 21EMA with a widening slope — momentum intact
* MACD histogram still building positive bars; momentum hasn’t rolled
* Stoch RSI elevated, but SPY can ride overbought for weeks
Volume expansion on up candles suggests real positioning, not just passive drift.
Daily Structure (Swing Bias)

Market Structure: The daily trendline from late summer continues to be respected. We got a push into 685, then a controlled pullback. As long as price respects the diagonal support, momentum stays bullish.
Key Daily Levels to Watch:
* Support: 671.50 → 668.50
* Resistance: 685 → 689
* Breakout Trigger: 690+ (potential extension squeeze)
A clean daily close above 685 flips the door open for a measured move higher.
Order Blocks & Liquidity: There’s a clean bullish OB around 667–672. If price rotates into this zone and rejects hard, that’s your high-prob entry.
Above 685, stops cluster — good fuel for a pop.
Indicators:
* EMAs trending up and separating
* MACD curling positive again; momentum rebuilding
* Stoch RSI cycling from a near-top, but not diverging yet
Momentum is cooling, not reversing.
15-Minute Structure (Intraday Rotation)

Market Structure: Intraday, SPY is surfing inside a descending micro-channel. We printed a BOS early, followed by a cleanup CHoCH that suggests accumulation at 679–680. Small liquidity grabs are forming under price.
This is the kind of structure that breaks upward if futures align.
Intraday Liquidity Zones:
* Above: 684–686 (magnet if shorts get squeezed)
* Below: 679 (trap zone)
* Deeper: 676 (big footprint buying interest)
Indicators (M15):
* MACD flattening — momentum pause
* Stoch RSI reset and curl up — room for upside rotation
Don’t be surprised by a morning liquidity sweep followed by continuation.
1-Hour GEX Map (Options Positioning & Dealer Flows)

This is where things get interesting.
Positive Gamma Walls (resistance):
* 685
* 690
Dealers hedge short-term options demand by capping volatility. That explains the sideways grind.
Put Support:
* 678
* 675
If price breaks 678 with force — volatility instantly expands. Dealers will hedge by shorting futures.
Max Pain Behavior: Gamma supports chop with mild upward bias. Don’t expect clean trends unless we break outside this GEX bracket.
Sentiment: Puts still hold 62% — traders are hedged. That often creates upside drift as protection decays.
Trade Scenarios
✅ Bullish Scenario
Condition: Reclaim and hold above 683.50 Entry: Break and retest of 685 Targets: 689 → 692 Stop: 681.25 Invalidation: Full body close below 679
Notes: If futures are green, upside squeezes happen fast.
⚠️ Bearish Scenario (Counter-Trend)
Condition: Fail and reject 685 with a strong red impulse Entry: Breakdown of 679 Targets: 676 → 672 Stop: 682 Invalidation: 683 reclaim
If SPY gives us a morning sweep + reclaim, shorts get trapped.
What to Watch This Week
* Liquidity hunts above 685 are likely
* Bears only gain momentum below 679
* Keep an eye on NQ — SPY is following tech rotation
If we hold 680–681 during the first hour, the setup favors upward continuation.
Closing Outlook
SPY is in a premium zone of its macro channel, and this is where markets loves to play games with psychology. Until sellers take initiative, momentum favors continuation with shallow dips.
My eyes are on:
* Reaction to 685
* Dealer hedging pressure shifting
* Early week liquidity sweep under 679
A clean reclaim after a trap is your squeeze ignition.
Disclaimer
This analysis is for educational purposes only and not financial advice. Always trade with risk discipline.
Weekly Structure (Macro Bias)
Market Structure: SPY has been grinding at the upper boundary of its rising macro channel, continuing a long series of BOS pushes. The most recent CHoCH was instantly reclaimed — that’s a bullish tell and suggests smart money defended aggressively. We’re now sitting right under fresh liquidity resting above last week’s highs.
Liquidity: Current price action shows clean liquidity grabs above prior pivot highs, followed by stabilization instead of sharp rejection. That’s constructive — but we’re reaching a zone where profit-taking historically appears.
Trend Direction: Still bullish on the weekly. Higher highs and higher lows are intact, but we’re extended into premium.
Weekly Supply & Demand:
* Demand: 613 → 600 (macro buy zone if we get any corrective rotation)
* Deeper Demand: 535 (big institutional buy pocket)
* Supply: 682–690 channel ceiling; don’t underestimate this
Smart money tends to rebalance right here before extending.
Indicators:
* 9EMA > 21EMA with a widening slope — momentum intact
* MACD histogram still building positive bars; momentum hasn’t rolled
* Stoch RSI elevated, but SPY can ride overbought for weeks
Volume expansion on up candles suggests real positioning, not just passive drift.
Daily Structure (Swing Bias)
Market Structure: The daily trendline from late summer continues to be respected. We got a push into 685, then a controlled pullback. As long as price respects the diagonal support, momentum stays bullish.
Key Daily Levels to Watch:
* Support: 671.50 → 668.50
* Resistance: 685 → 689
* Breakout Trigger: 690+ (potential extension squeeze)
A clean daily close above 685 flips the door open for a measured move higher.
Order Blocks & Liquidity: There’s a clean bullish OB around 667–672. If price rotates into this zone and rejects hard, that’s your high-prob entry.
Above 685, stops cluster — good fuel for a pop.
Indicators:
* EMAs trending up and separating
* MACD curling positive again; momentum rebuilding
* Stoch RSI cycling from a near-top, but not diverging yet
Momentum is cooling, not reversing.
15-Minute Structure (Intraday Rotation)
Market Structure: Intraday, SPY is surfing inside a descending micro-channel. We printed a BOS early, followed by a cleanup CHoCH that suggests accumulation at 679–680. Small liquidity grabs are forming under price.
This is the kind of structure that breaks upward if futures align.
Intraday Liquidity Zones:
* Above: 684–686 (magnet if shorts get squeezed)
* Below: 679 (trap zone)
* Deeper: 676 (big footprint buying interest)
Indicators (M15):
* MACD flattening — momentum pause
* Stoch RSI reset and curl up — room for upside rotation
Don’t be surprised by a morning liquidity sweep followed by continuation.
1-Hour GEX Map (Options Positioning & Dealer Flows)
This is where things get interesting.
Positive Gamma Walls (resistance):
* 685
* 690
Dealers hedge short-term options demand by capping volatility. That explains the sideways grind.
Put Support:
* 678
* 675
If price breaks 678 with force — volatility instantly expands. Dealers will hedge by shorting futures.
Max Pain Behavior: Gamma supports chop with mild upward bias. Don’t expect clean trends unless we break outside this GEX bracket.
Sentiment: Puts still hold 62% — traders are hedged. That often creates upside drift as protection decays.
Trade Scenarios
✅ Bullish Scenario
Condition: Reclaim and hold above 683.50 Entry: Break and retest of 685 Targets: 689 → 692 Stop: 681.25 Invalidation: Full body close below 679
Notes: If futures are green, upside squeezes happen fast.
⚠️ Bearish Scenario (Counter-Trend)
Condition: Fail and reject 685 with a strong red impulse Entry: Breakdown of 679 Targets: 676 → 672 Stop: 682 Invalidation: 683 reclaim
If SPY gives us a morning sweep + reclaim, shorts get trapped.
What to Watch This Week
* Liquidity hunts above 685 are likely
* Bears only gain momentum below 679
* Keep an eye on NQ — SPY is following tech rotation
If we hold 680–681 during the first hour, the setup favors upward continuation.
Closing Outlook
SPY is in a premium zone of its macro channel, and this is where markets loves to play games with psychology. Until sellers take initiative, momentum favors continuation with shallow dips.
My eyes are on:
* Reaction to 685
* Dealer hedging pressure shifting
* Early week liquidity sweep under 679
A clean reclaim after a trap is your squeeze ignition.
Disclaimer
This analysis is for educational purposes only and not financial advice. Always trade with risk discipline.
تم فتح الصفقة
SPY Outlook for Nov. 4SPY broke structure to the downside (BOS) and confirmed a CHoCH, then failed the retest of the descending trendline. Momentum (MACD/Stoch) still points lower, suggesting sellers remain in control into tomorrow’s open.
Support: 681.00 → 679.90 A break below this can extend toward 677 liquidity.
Resistance: 682.90 → 684.20 Bulls must reclaim these levels to shift momentum back up.
Bias: Slightly bearish unless SPY reclaims 684+ with strength.
Trade Idea: Look for rejection near 682.50–683 to scalp puts toward 680–679.90. Calls only if price reclaims 684.20 and holds.
ملاحظة
Premarket Overview — SPYSPY is still respecting the descending channel, with price rejecting off the 9/21 EMA stack and pushing lower. Buyers attempted a bounce, but momentum faded fast. Price is now drifting toward the lower trendline, with premarket lows in view.
Bias: Slightly bearish into open unless SPY can reclaim 676.75–677.17.
Levels to Watch:
* Resistance: 676.75 → 677.17 Break + hold = small relief bounce.
* Support: 675.30 → 673.78 (PML) Lose this zone = continuation flush.
Indicators:
* MACD rolling red again — sellers active.
* Stoch RSI near oversold, but can ride it lower in trend.
Gameplan:
* PUT scalp on rejection near EMAs until we see structure break.
* CALL only above 677.17 with a retest hold.
Stay patient — first 5–10 min will set direction.
إخلاء المسؤولية
The information and publications are not meant to be, and do not constitute, financial, investment, trading, or other types of advice or recommendations supplied or endorsed by TradingView. Read more in the Terms of Use.
إخلاء المسؤولية
The information and publications are not meant to be, and do not constitute, financial, investment, trading, or other types of advice or recommendations supplied or endorsed by TradingView. Read more in the Terms of Use.