Hello traders!
If you "Follow" us, you can always get new information quickly.
Please also click “Boost”.
Have a good day.
-------------------------------------
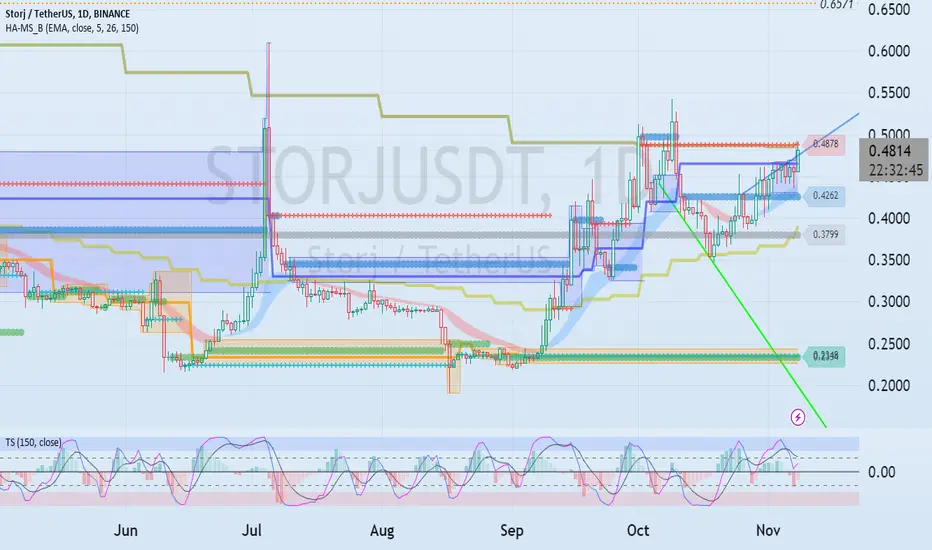
(STRJUSDT chart)

If it receives support in the 0.4292-0.4878 range and rises, it is expected that a full-fledged upward trend will begin.
(1W chart)

However, a rapid upward trend is expected to begin when the box range of 0.6939-3.1133 is shortened and a new box range is formed.
Therefore, it is expected that the price will rise above 0.4878 and shake up and down, creating a new HA-High indicator.
(1D chart)

If it rises above 0.4878 and becomes supported, the first support and resistance area is expected to be around 0.6571-0.7225.
--------------------------------------------------
- The big picture

The full-fledged upward trend is expected to begin when the price rises above 29K.
This is the section expected to be touched in the next bull market, 81K-95K.
-------------------------------------------------- -------------------------------------------
** All explanations are for reference only and do not guarantee profit or loss in investment.
** Trading volume is displayed as a candle body based on 10EMA.
How to display (in order from darkest to darkest)
More than 3 times the trading volume of 10EMA > 2.5 times > 2.0 times > 1.25 times > Trading volume below 10EMA
** Even if you know other people’s know-how, it takes a considerable amount of time to make it your own.
** This chart was created using my know-how.
---------------------------------
If you "Follow" us, you can always get new information quickly.
Please also click “Boost”.
Have a good day.
-------------------------------------
(STRJUSDT chart)
If it receives support in the 0.4292-0.4878 range and rises, it is expected that a full-fledged upward trend will begin.
(1W chart)
However, a rapid upward trend is expected to begin when the box range of 0.6939-3.1133 is shortened and a new box range is formed.
Therefore, it is expected that the price will rise above 0.4878 and shake up and down, creating a new HA-High indicator.
(1D chart)
If it rises above 0.4878 and becomes supported, the first support and resistance area is expected to be around 0.6571-0.7225.
--------------------------------------------------
- The big picture
The full-fledged upward trend is expected to begin when the price rises above 29K.
This is the section expected to be touched in the next bull market, 81K-95K.
-------------------------------------------------- -------------------------------------------
** All explanations are for reference only and do not guarantee profit or loss in investment.
** Trading volume is displayed as a candle body based on 10EMA.
How to display (in order from darkest to darkest)
More than 3 times the trading volume of 10EMA > 2.5 times > 2.0 times > 1.25 times > Trading volume below 10EMA
** Even if you know other people’s know-how, it takes a considerable amount of time to make it your own.
** This chart was created using my know-how.
---------------------------------
※ Follow X to check out the posts.
※ X를 팔로우하고 게시물을 확인하세요.
◆ t.me/readCryptoChannel
[HA-MS Indicator]
bit.ly/3YxHgvN
[OBV Indicator]
bit.ly/4dcyny3
※ X를 팔로우하고 게시물을 확인하세요.
◆ t.me/readCryptoChannel
[HA-MS Indicator]
bit.ly/3YxHgvN
[OBV Indicator]
bit.ly/4dcyny3
منشورات ذات صلة
إخلاء المسؤولية
لا يُقصد بالمعلومات والمنشورات أن تكون، أو تشكل، أي نصيحة مالية أو استثمارية أو تجارية أو أنواع أخرى من النصائح أو التوصيات المقدمة أو المعتمدة من TradingView. اقرأ المزيد في شروط الاستخدام.