SUI/USDT - 4-Hour Chart Analysis: Potential Bullish Continuation
This analysis focuses on the 4-hour chart of SUI/USDT on Binance. Key observations include:
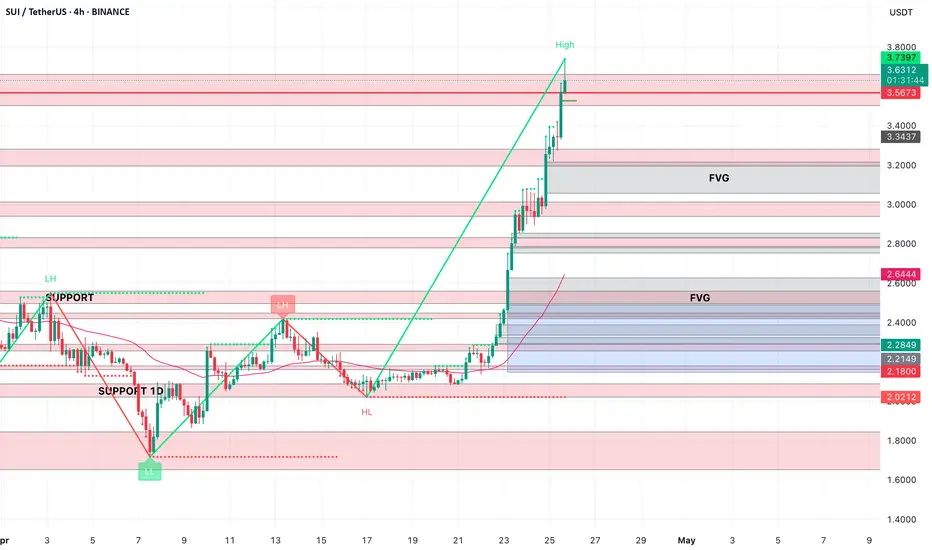
Current Price: SUI is trading at $3.6423, up 1.95% from the previous close.
Recent High: The recent high is $3.7397.
Support Levels: Key support levels are identified at $2.12 and $1.80. There's also a support zone labeled "SUPPORT 1D."
Fair Value Gap (FVG): There are two Fair Value Gaps (FVG) marked on the chart, one above the current price and one below, which could act as potential areas of interest.
Potential Bullish Trend: The chart suggests a potential continuation of the bullish trend, with the price moving upwards from the support levels.
Disclaimer: This is not financial advice. Please do your own research before making any trading decisions.
This analysis focuses on the 4-hour chart of SUI/USDT on Binance. Key observations include:
Current Price: SUI is trading at $3.6423, up 1.95% from the previous close.
Recent High: The recent high is $3.7397.
Support Levels: Key support levels are identified at $2.12 and $1.80. There's also a support zone labeled "SUPPORT 1D."
Fair Value Gap (FVG): There are two Fair Value Gaps (FVG) marked on the chart, one above the current price and one below, which could act as potential areas of interest.
Potential Bullish Trend: The chart suggests a potential continuation of the bullish trend, with the price moving upwards from the support levels.
Disclaimer: This is not financial advice. Please do your own research before making any trading decisions.
إخلاء المسؤولية
The information and publications are not meant to be, and do not constitute, financial, investment, trading, or other types of advice or recommendations supplied or endorsed by TradingView. Read more in the Terms of Use.
إخلاء المسؤولية
The information and publications are not meant to be, and do not constitute, financial, investment, trading, or other types of advice or recommendations supplied or endorsed by TradingView. Read more in the Terms of Use.